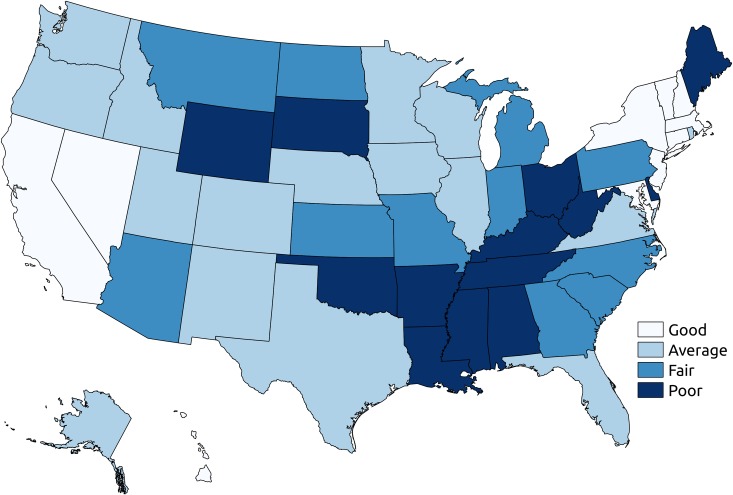
Fig 2. State-level FTIMR classification.
The figure shows state level classification: states with good FTIMR (1.25 ≤ FTIMR < 1.75), states with average FTIMR (1.75 ≤ FTIMR < 2.25), states with fair FTIMR (2.25 ≤ FTIMR < 2.75), and states with poor FTIMR (FTIMR ≥ 2.75). All estimates are for full-term infants born in 2010–2012. FTIMR, full-term infant mortality rate.

