Several errors occurred in the data within the third and fifth paragraphs of the section "Phylogeography", and the third and fourth paragraphs within "Linguistic isolates: Ladin and Grecani Salentini" under the Results section. Please see the corrected paragraphs, with updated haplogroup percentages below:
Phylogeography:
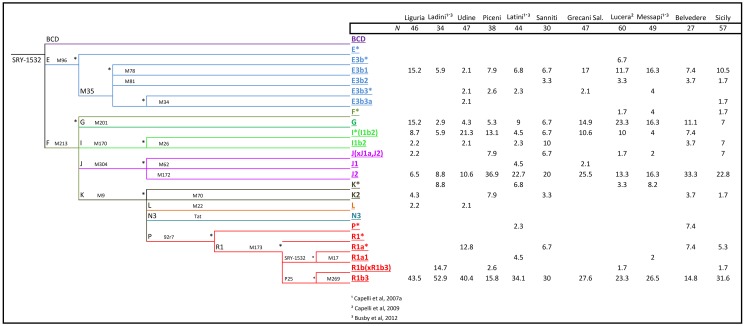
A total of 282 Y-chromosomes were analyzed for a set of Y-SNPs and were classified into 22 different haplogroups (Figure 3). Two haplogroups were not found, even though markers defining these clades were tested: N3 and R1a1. Five haplogroups represented 76.71% of the total chromosomes: R1b3, J2, I(xI1b2), E3b1 and G. The frequencies averaged across populations were 31%, 19%, 8.3%, 10.2% and 11.2%, respectively. The remaining haplogroups sum to 18.6% in the total sample, and never above 2.7% in single population samples.
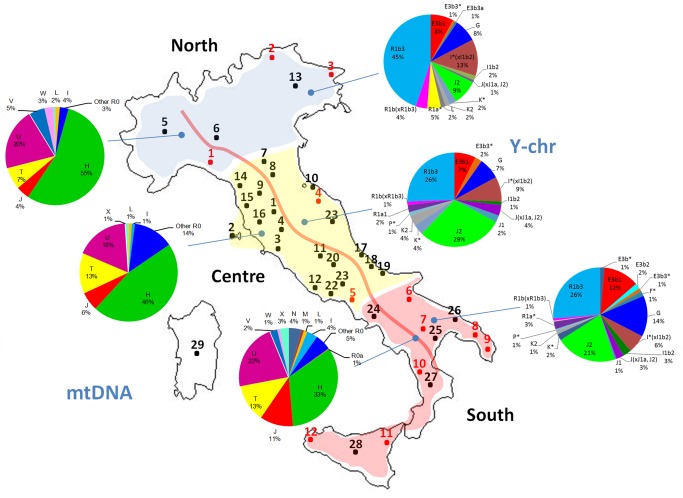
Regional differences are substantially higher in the Y-chromosome than in the mtDNA. Thus, for instance, haplogroup R in the Y-chromosome was 53% in the North, 29.3% in the Center, and 30% in the South. Frequency differences were statistically significant between North vs Center (Pearson’s chi-square, unadjusted-P value = 0.0014), and North vs South (Pearson’s chi-square, unadjusted-P value < 0.00004). Haplogroup J2 also revealed important regional differences; it added to 9% in the North 29.3% in the Center, and 20.7% in the South, with statistically significant differences between the North vs Center (Pearson's chi-square, unadjusted-P value<0.00002), North vs South (Pearson's chi-square, unadjusted-P value<0.00148), and in the limit of significance Center vs South (Pearson's chi-square, unadjusted-P value<0.049).
Linguistic isolates: Ladin and Grecani Salentini:
The differences between Ladin and other populations were more evident when examining haplogroup frequency patterns (Figure 4). The frequency of haplogroup H (66%) was above the frequency of H in North Italy (55%), and was extremely high (66%) compared to the average for Italy (38%) (Pearson’s Chi-square test, P-value = 0.0005). While haplogroup U was found to have approximately the same frequency as other Italian populations, haplogroup T was 5% compared to 12% in Italy generally (7% in the North). Other differences were apparent, but sample sizes were relatively low to yield significant statistical differences.
Differences are more important when examining Y-chromosome haplogroup frequencies. R1b3 reached 53% in Ladin populations but only 31% in the general population, and also in the North (Pearson's Chi-square test, P-value = 0.0087); Figure 4. More remarkable are the differences when considering the remaining R1b lineages, that is, R1b(xR1b3), which account for 15% of the lineages in Ladins, but only for 2% in the general population (Pearson's Chi-square test, P-value = 0.0001). Other haplogroups showed substantial haplogroup differences (e.g. J2) but the sample size was again too small.
Figures 1 and 3 have been updated accordingly. Please view the corrected images below:
Figure 1:
Figure 3:
Footnotes
Competing Interests: No competing interests declared.


