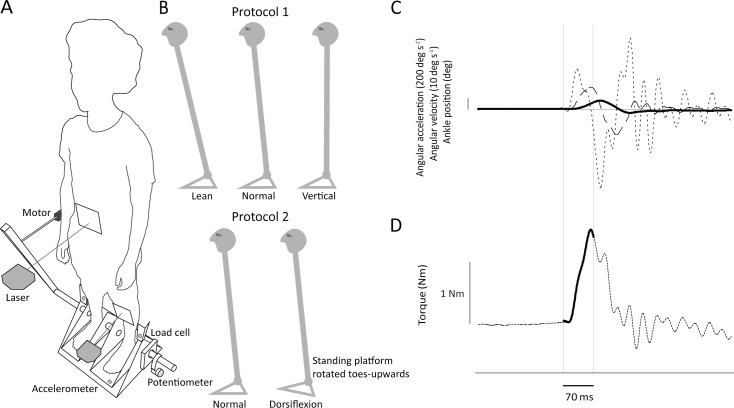
Fig 1. Experimental setup.
(A) The position servo motor was installed horizontally and applied perturbations to the crank, thus rotating the platform and footplates. Separate load cells measured torque for each ankle. They transmitted all forces between the platform and footplates, directly above the axis of rotation. A potentiometer attached to the axis of rotation measured anteroposterior rotation of the footplate. An accelerometer attached underneath the left footplate measured its acceleration. Two laser-reflex sensors placed at left mid-tibia and umbilicus level tracked the anteroposterior shin and body tilt. (B) During study 1 (top figures), the standing platform was level and the participant altered body position. During study 2 (bottom figures), the standing platform was rotated upwards by 15 deg during the dorsiflexion condition. Only left lower limb recordings were used for stiffness and sway analysis, and surface EMG was recorded from the medial gastrocnemius and tibialis anterior muscles. (C) Example of averaged ankle angle (continuous line), angular velocity (dashed line) and angular acceleration (dotted line) data used to estimate mechanical intrinsic ankle stiffness. The time-window (70 ms) used for the analysis are indicated by the thin vertical lines. The starting point coincides with the stimulus onset. (D) Ankle torque response (dotted line) and, on top of it, reconstructed torque (continuous line) obtained from the second order model used to estimate stiffness. The bottom horizontal line indicates 14.5 Nm.

