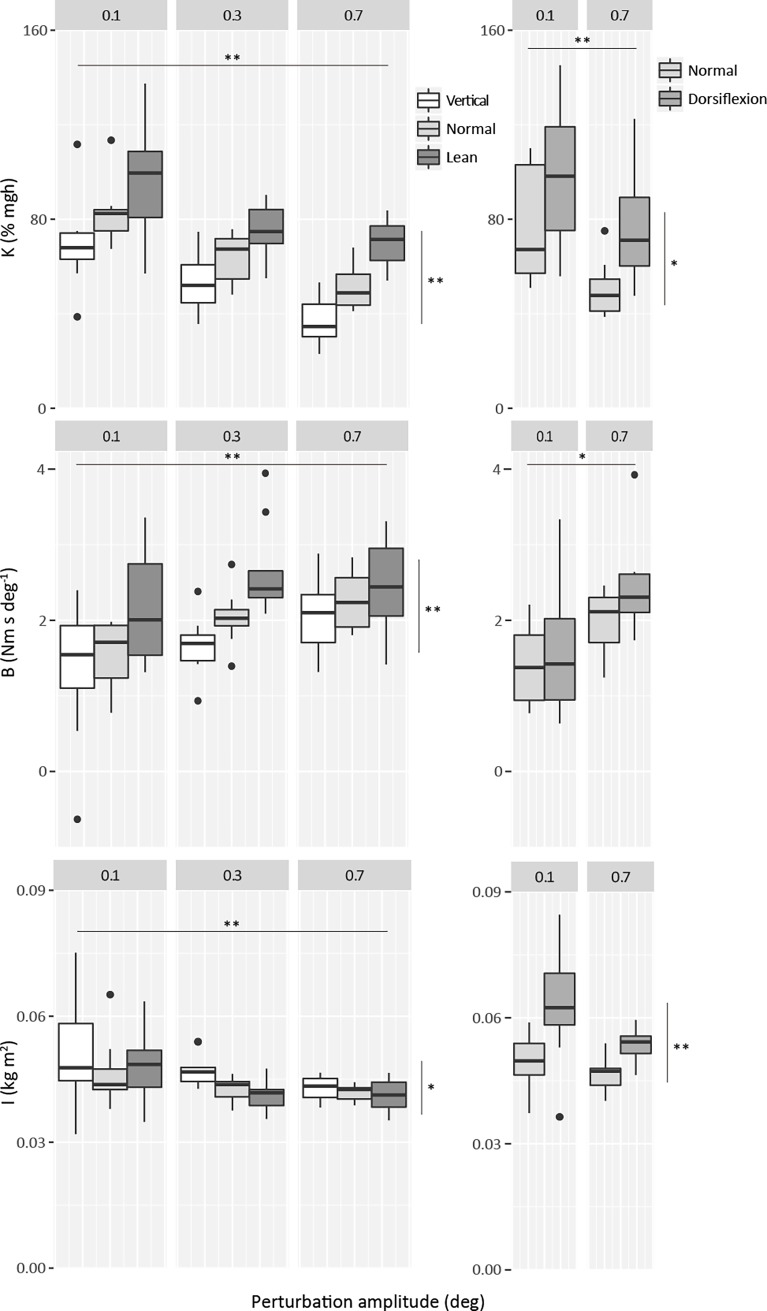
Fig 5. Intrinsic standing ankle stiffness (% mgh), viscosity (Nm s deg-1) and moment of inertia (kg m2) against perturbation amplitude (deg).
Intrinsic stiffness was estimated with the left torque values multiplied by 2. Viscosity and moment of inertia values are from left ankle only. Horizontal lines indicate significance of perturbation amplitude, whereas vertical lines indicate significance of condition. (*) indicates significance of P<0.05, and (**) indicates P<0.001.

