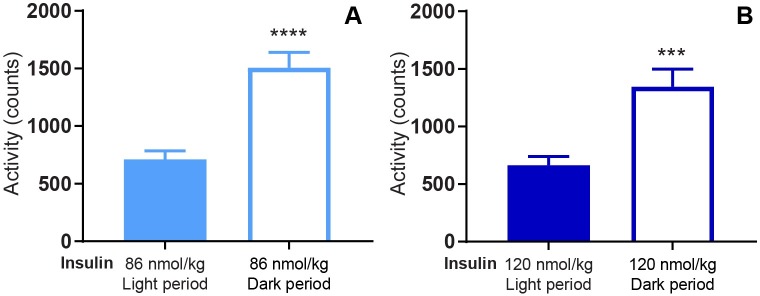
Fig 3. Mean activity during light and dark periods.
Mean activity from 0–8 h. after dosing of 86 nmol/kg insulin (A) and 120 nmol/kg insulin (B) during both light and dark periods. Data are expressed as means of 5 days (86 nmol/kg) and 2 days (120 nmol/kg), respectively ± SEM; n = 7–8. The significant differences in activity between the light and the dark period are indicated by **** (p < 0.0001) and *** (p = 0.0003), respectively (analyzed using a two-tailed paired t-test).

