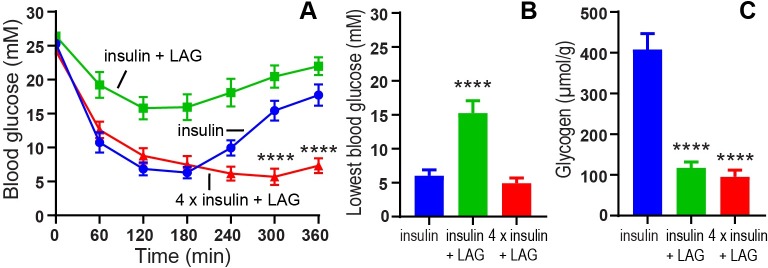
Fig 7. Glucagon effect on blood glucose and glycogen content in the liver.
A) Blood glucose (mM) plotted as function of time. At t = 0 min. the animals were dosed sc. with insulin (103 nmol/kg), insulin (103 nmol/kg) + LAG (1 nmol/kg) or 4 x insulin (412 nmol/kg) + LAG (1 nmol/kg). Blood glucose was measured in tail tip blood for 6 hours. Significant lower blood glucose levels with 4 x insulin + LAG after 300 and 360 min are indicated by **** (p < 0.0001), (analyzed using two-way ANOVA followed by Tukey’s multiple comparisons test). B) The lowest blood glucose levels (mM) obtained during the 6-hour experiment. C) Liver glycogen content (μmol/g tissue) 6 hours after sc. dosing. Data are expressed as means ± SEM; n = 12. A significant impaired blood glucose lowering effect of 103 nmol/kg insulin + 1 nmol/kg LAG (B), and a significant increased glycogen content in the liver (C) are indicated by **** (p < 0.0001), (analyzed using one-way ANOVA followed by Tukey’s multiple comparisons test).

