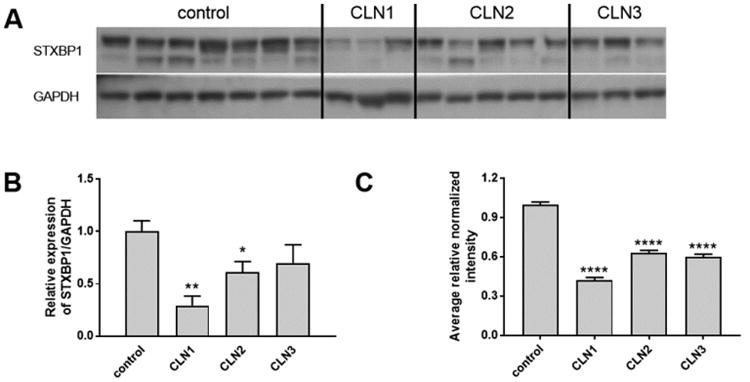
Figure 10.

Western blot analysis of STXBP1. (A) Western blot of STXBP1 and GAPDH loading control in brain extracts. (B) Quantitation of Western blot. Data were normalized to GAPDH and are expressed relative to control and error bars show SEM. Significance compared with control was calculated by one-way ANOVA using Dunnett's multiple comparison test. (C) Quantitative MS data for STXBP1. Data are expressed relative to control. Ratios, errors, and significance compared with control were calculated as described in the Experimental Procedures section. *, p < 0.05; **, p < 0.01; ***, p < 0.005; ****, p < 0.001.
