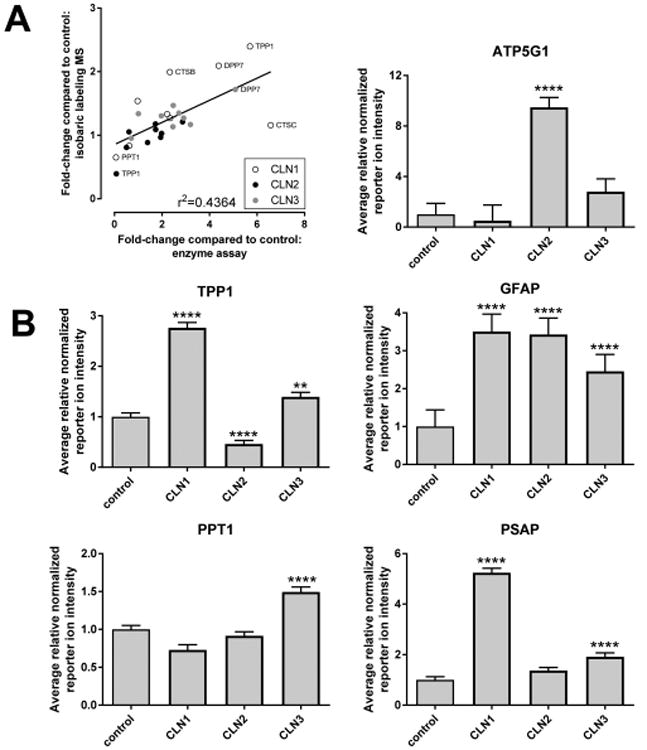
Figure 6.

Validation of isobaric-label MS quantitation. (A) Comparison of lysosomal protein expression and activity determined by isobaric labeling/quantitative MS and enzyme assay, respectively. (B) Expression levels of proteins that are known to be altered in NCL diseases. For each NCL, the average relative normalized reporter ion intensity for all samples is shown and error bars indicate standard error. Data are expressed relative to control. Ratios, errors, and significance compared with control were calculated as described in the Experimental Procedures section. *, p < 0.05; **, p < 0.01; ***, p < 0.005; ****, p < 0.001.
