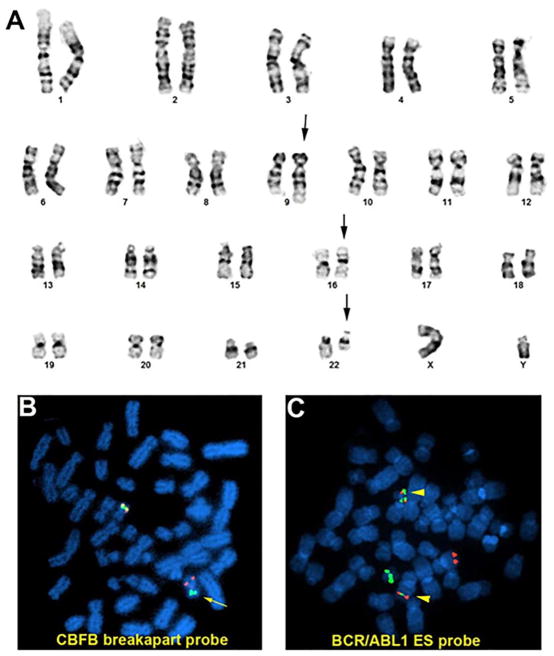
FIGURE 3.
Karyotype and FISH analysis of case #1. A. Karyotype of 46,XY,t(9;22)(q34;q11.2),inv(16)(p13q22). B. FISH analysis using LSI CBFB breakapart probe on a metaphase. Chromosome with break signal (red & green, marked by arrow) indicates CBFB rearrangement; C. FISH analysis using LSI BCR/ABL1 ES probe on a metaphase. Two fusion signals (yellow, marked by arrow head) indicate BCR/ABL1 rearrangement. [Color figure can be viewed at wileyonlinelibrary.com]

