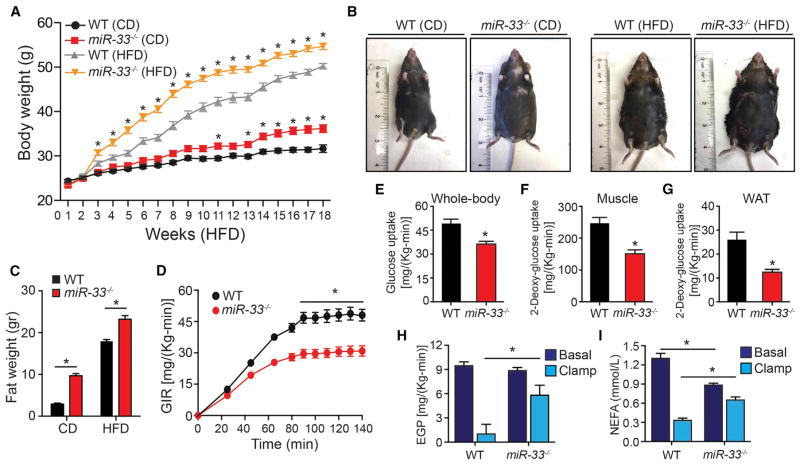
Figure 1. Genetic Ablation of MiR-33 Results in Obesity and Whole-Body Insulin Resistance.
(A) Body weight of WT and miR-33−/− mice fed a chow diet (CD) or high-fat diet (HFD) for 20 weeks. (n = 20 for CD and ≥ 30 for HFD.)
(B) Representative images of WT and miR-33−/− mice fed a CD or HFD for 20 weeks.
(C) Fat mass of WT and miR-33−/− mice fed a CD or HFD for 20 weeks (n = 6).
(D) Glucose infusion rate (GIR) during hyperinsulinemic-euglycemic clamp in WT and miR-33−/− mice fed a CD for 20 weeks (n = 9).
(E) Whole-body glucose uptake during the hyperinsulinemic-euglycemic clamp in WT and miR-33−/− mice fed a CD for 20 weeks (n = 9).
(F and G) Muscle (F) and adipose tissue (G) 2-deoxyglucose uptake during hyperinsulinemic-euglycemic clamp in WT and miR-33−/− mice fed a CD for 20 weeks (n = 9).
(H) Endogenous glucose production (EGP) measured in the basal period and during the hyperinsulinemic-euglycemic clamp in WT and miR-33−/− mice fed a CD for 20 weeks (n = 9).
(I) Circulating non-esterified fatty acids in WT and miR-33−/− mice fed a CD for 20 weeks (n = 9). All data represent the mean ± SEM, and an asterisk indicates p < 0.05 comparing miR-33−/− with WT mice on the same diet.

