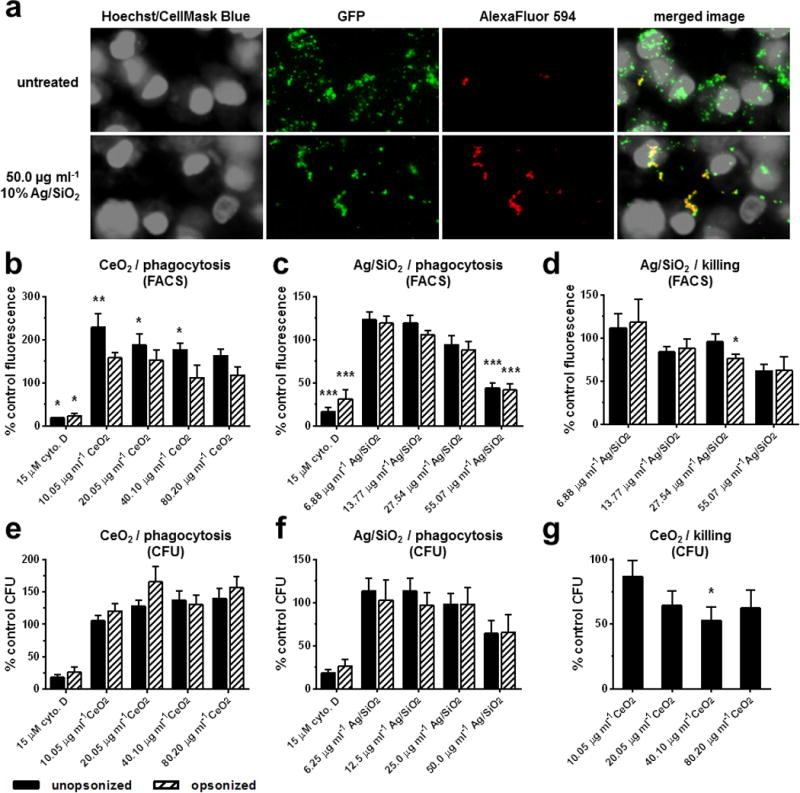
Figure 5.

F. tularensis phagocytosis and killing, scanning cytometry, images, flow cytometry and lysis/cfu. Adherent PMA-matured THP-1 cells were incubated for 4 hours with indicated concentrations of 10% Ag/SiO2 or CeO2 prior to or following incubation for 2 hours with F. tularensis. (a) representative confocal fluorescence images from FT phagocytosis experiments. All bacteria (GFP-expressing) are seen in the green channel, and external bacteria, labeled by indirect immunofluorescence staining with AlexaFluor 594, are seen in the red channel. (b, c) quantification of flow cytometry (mean percent control fluorescence) for FT phagocytosis by cells treated with cytochalasin D control or indicated concentrations of either CeO2 or Ag/SiO2 ENMs. (d) quantification of flow cytometry for FT killing by cells treated with indicated concentrations of Ag/SiO2 ENM. (e, f) quantification of cell lysis and CFU count experiments (percent control CFU) for FT phagocytosis by cells treated with indicated concentrations of CeO2 or Ag/SiO2 ENMs. (g) quantification of cell lysis and CFU count experiments for FT phagocytosis by cells treated with indicated concentrations of CeO2 ENM. Results represent means ± standard deviation, N=3; * = p<0.05; ** = p<0.01; ***=p<0.001
