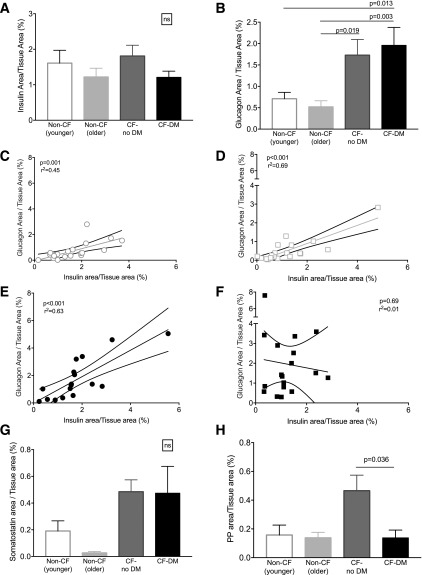
Figure 2.
Quantitation of islet endocrine cell types in subjects with and subjects without CF. Insulin area (A) and glucagon area (B) normalized to total tissue area. Linear regression analysis for the relationship between relative insulin and glucagon areas in non-CF (younger) control subjects (C), non-CF (older) control subjects (D), and CF-no DM (E) and CFRD (F) subjects. In a subset of subjects (n = 10 per group), somatostatin area (G) and pancreatic polypeptide area (H) normalized to total tissue area.

