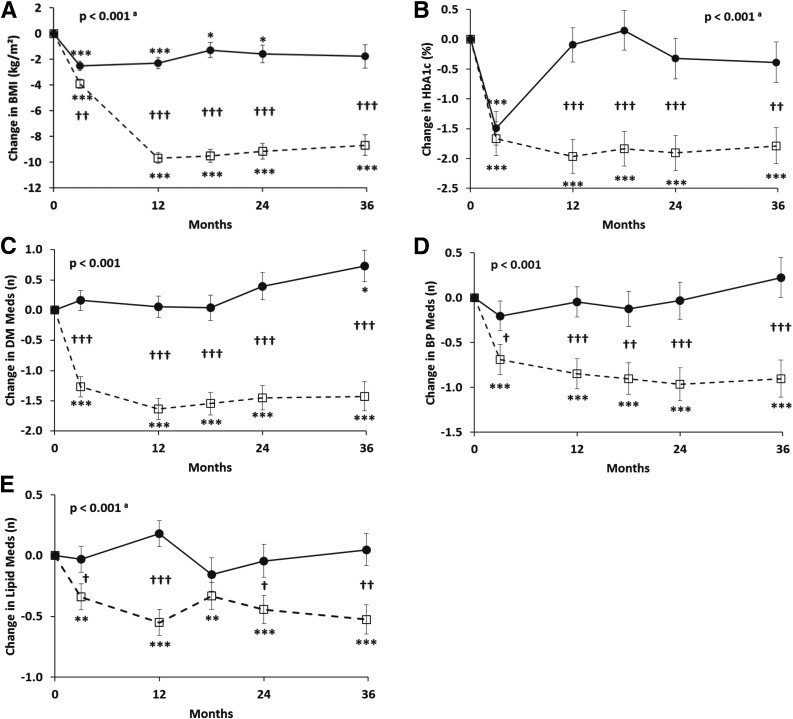
Figure 1.
Changes (±SEM) in BMI (A), HbA1c (B), and antidiabetes (C), antihypertensive (D), and lipid-lowering (E) medications over 36 months in obese patients with type 2 diabetes randomized to RYGB (open squares with dashed lines) versus IMWM (filled circles with solid lines). P values represent overall differences between treatment groups by linear mixed-effects models adjusted for baseline values. atime × group interaction also significant at P < 0.05. *P < 0.05, **P < 0.01, ***P < 0.001 vs. baseline. †P < 0.05, ††P < 0.01, †††P < 0.001 between groups. DM Meds, antidiabetes medications; BP Meds, antihypertensive medications; Lipid Meds, lipid-lowering medications.

