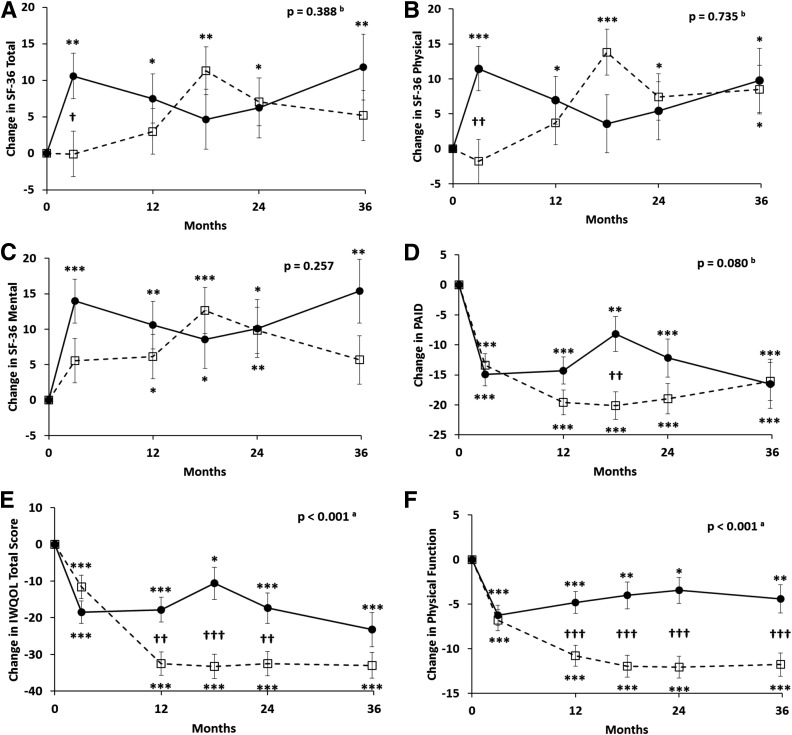
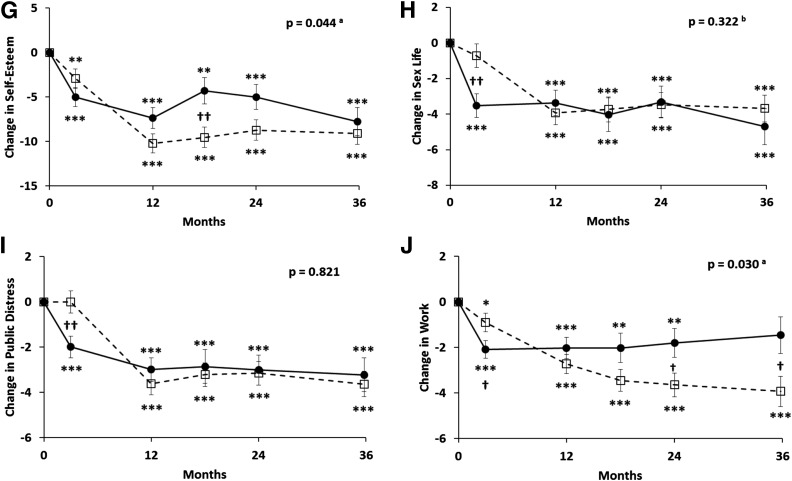
Figure 2.
Changes (±SEM) in SF-36 total score (SF-36 Total) (A), SF-36 physical (B), SF-36 mental (C), PAID (D), and IWQOL total score (E), and subscales of physical function (F), self-esteem (G), sex life (H), public distress (I), and work performance (J) over 36 months in obese patients with type 2 diabetes randomized to RYGB (open squares with dashed lines) versus IMWM (filled circles with solid lines). In A–C, an increase in score indicates improvement (better health status). In D–J, a decrease in score indicates improvement (fewer problems with diabetes or less impact of weight on quality of life). P values represent overall differences between treatment groups by linear mixed-effects model adjusted for baseline values. atime × group interaction also significant at P < 0.05. btime × group interaction significant at P < 0.05 but group effect not significant. *P < 0.05, **P < 0.01, ***P < 0.001 vs. baseline. †P < 0.05, ††P < 0.01, †††P < 0.001 between groups.


