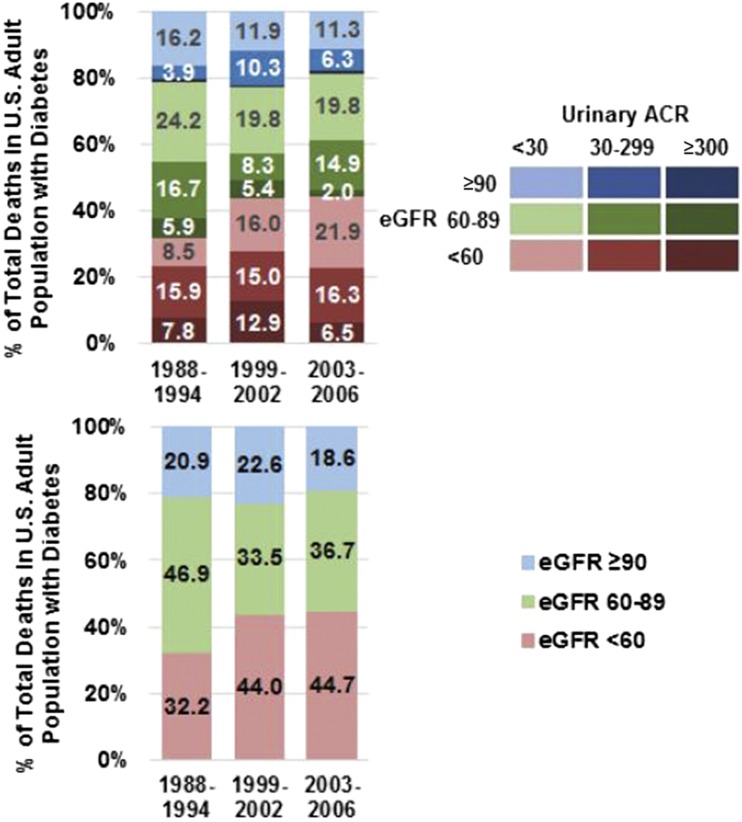
Figure 2.
Distribution of deaths in the U.S. population with diabetes by time period and by CKD phenotypes. The top panel shows the distribution of ACR groups within eGFR groups by time period, and the bottom panel shows the distribution of eGFR groups by time period (15).

