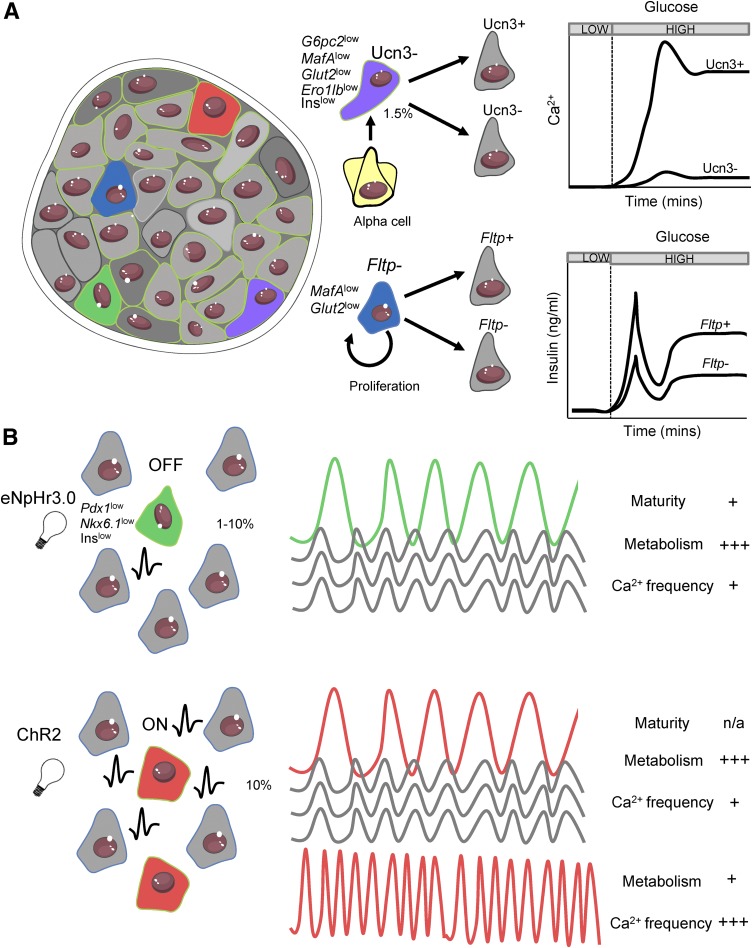
Figure 3.
Heterogeneity in the intact islet. A: Different β-cell subpopulations coexist within the islet, each characterized by different gene/protein expression patterns, morphological markers, glucose responsiveness, insulin secretion, and proliferative capacity and function (Fig. 1). Fltp− proliferative (blue) and Ucn3− transdifferentiating (purple) less functional immature populations are likely nonelectrically coupled and thus do not significantly affect islet-wide responses to glucose. B: Optogenetic mapping reveals highly functional β-cell subpopulations with varying identity markers, metabolic properties, and Ca2+ responses, but with the ability to exert disproportionate control over coordination and intraislet Ca2+ responses. This includes eNpHR3.0-silenced β-cells (hub cells, green) in which halorhodopsin activation and membrane hyperpolarization disproportionally silence the islet and ChR2-activated cells (red) in which ChR2 activation and membrane depolarization disproportionally activate the islet. A population of cells in which ChR2 activation has little effect also shows pacemaker-like characteristics owing to their higher intrinsic oscillation frequency. Adapted from Servier Medical Art under a CC-BY3.0 license (https://creativecommons.org/licenses/by/3.0/).

