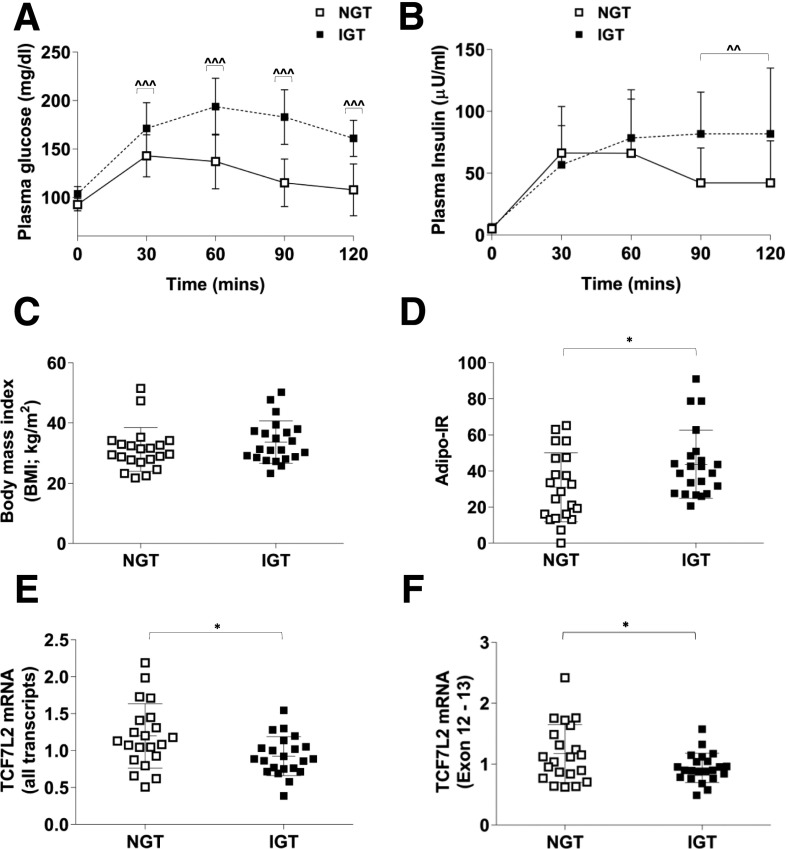
Figure 7.
Plasma glucose (A) and insulin (B) during an oral GTT in human subjects with NGT (n = 21) or IGT (n = 22). ^^P < 0.05; ^^^P < 0.001 vs. corresponding NGT time point by two-way ANOVA time × NGT/IGT phenotype interaction Holm-Šidák multiple comparison t test. C: BMI was similar between the two groups. D: Adipo-IR was higher in IGT subjects. *P < 0.05 vs. NGT by t test. Subcutaneous adipose tissue total TCF7L2 mRNA (exon 10-11; assay ID: Hs01009038_m1) (E) and a short TCF7L2 mRNA variant incorporating exons 12 and 13 (F) were lower in IGT subjects with Adipo-IR. *P < 0.05 Welch t test vs. NGT.

