
Figure 4. Venn diagram showing the distribution of positive results for each of the three UroSEEK assays for the (A) BC early detection (B) UTUC and (C) BC surveillance cohorts.
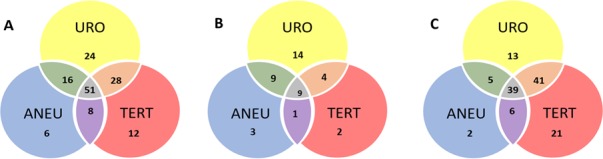
URO = Ten gene panel, TERT = TERT promoter region, ANEU = Aneuploidy test.