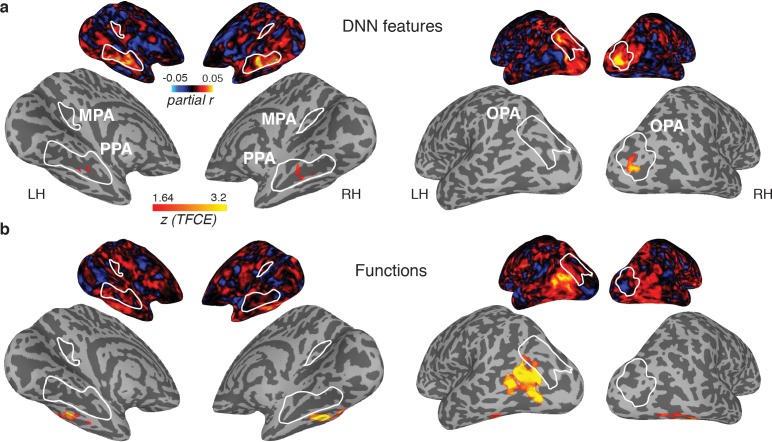
Figure 6. Medial (left) and lateral (right) views of group-level searchlights for (A) the DNN and (B) function model, overlaid on surface reconstructions of both hemispheres of one participant.
Each map was created by submitting the partial correlation maps for each model and hemisphere to one-sample tests against a mean of zero, cluster-corrected for multiple comparisons using Threshold-Free Cluster Enhancement (thresholded on z = 1.64, corresponding to one-sided p<0.05). Unthresholded versions of the average partial correlation maps are inset above. Group-level ROIs PPA, OPA and MPA are highlighted in solid white lines. Consistent with the ROI analyses, the DNN feature model contributed uniquely to representation in PPA and OPA. The function model uniquely correlated with a bilateral ventral region, as well as a left-lateralized region overlapping with the middle temporal and occipital gyri.

