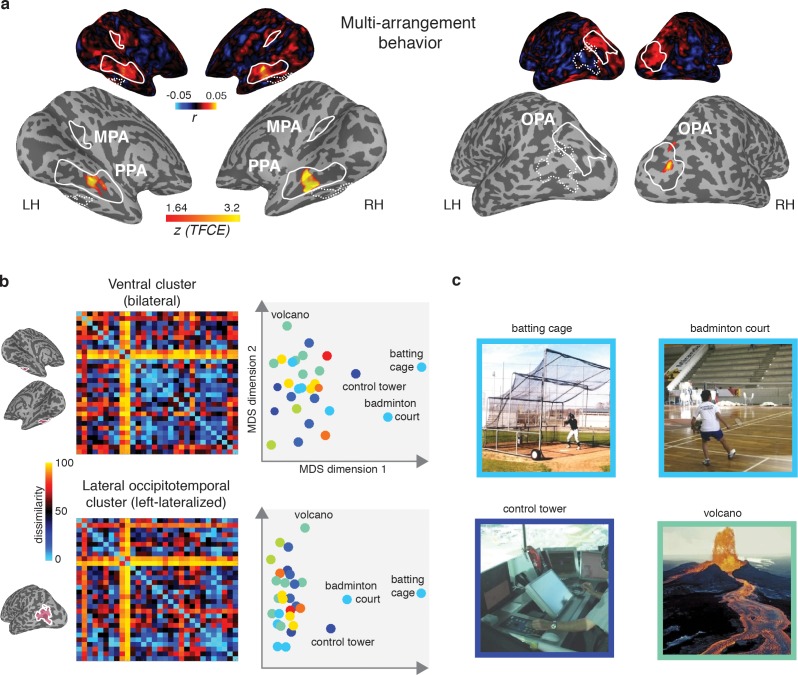
Figure 7. Multi-arrangement behavior searchlights and post-hoc analysis of functional clusters. .
(A) Searchlight result for behavioral scene categorization. Maps reflect correlation (Pearson’s r) of the group-average behavior in the multi-arrangement task from the participants of Experiment 1. Scene-selective ROIs are outlined in white solid lines; the searchlight clusters showing a significant contribution of the functional model are outlined in dashed white lines for reference. See Figure 6 for further explanation of the searchlight display. (B) RDM and MDS plots based on the MVPA patterns in the function model searchlight clusters. RDM rows are ordered as in Figure 1B and category color coding in the MDS plots is as in Figure 1C. (C) Illustrative exemplars of the four categories that were most dissimilar from other categories within the searchlight-derived clusters depicted in B.

