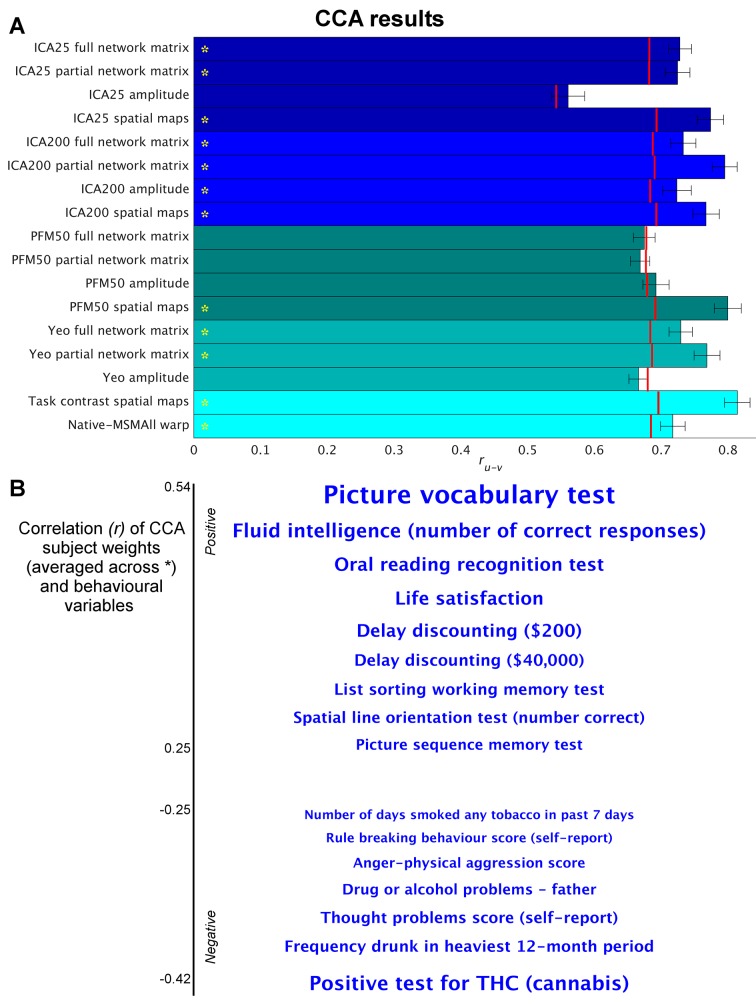
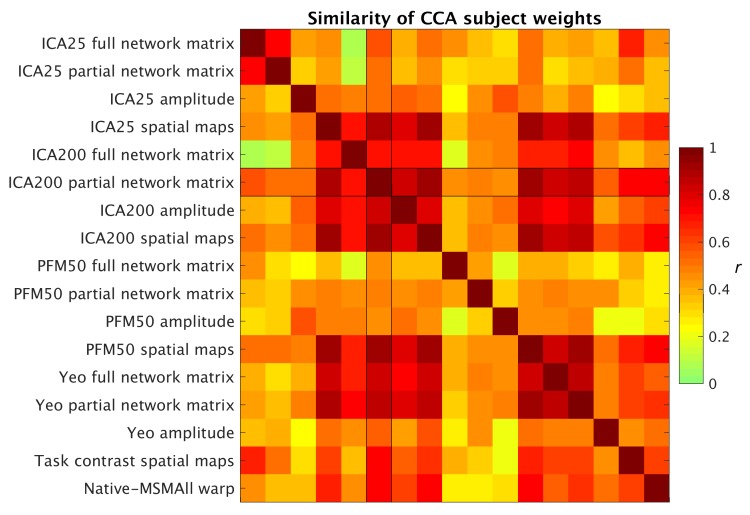
Figure 1. Highly similar associations between behaviour and the brain occur across 17 distinct measures derived from fMRI.
(A) Comparison of strength of CCA result for network matrices, spatial maps and amplitudes (node timeseries standard deviation) derived from several distinct group-average spatial parcellations/decompositions: ICA decompositions at two scales of detail (dimensionalities of 25 and 200, with ‘ICA200 partial network matrix’ corresponding to the measures used previously [Smith et al., 2015]); a PROFUMO decomposition (PFM; dimensionality 50); an atlas-based hard parcellation (108 parcels [Yeo et al., 2011]), task contrast spatial maps (86 contrasts, 47 unique), and warp field from native space to MSMAll alignment. Each bar reports a separate CCA analysis (first CCA mode shown), performed against behaviour/life-factors. A similar mode of variation is found across most of the parcellation methods and different fMRI measures. rUV is the strength of the canonical correlation between imaging and non-imaging measures. Error bars indicate confidence intervals (2.5–97.5%) estimated using surrogate data (generated with the same correlation structure), and red lines reflect the p<0.002 significant threshold compared with a null distribution obtained with permutation testing (i.e. family-wise-error corrected across all CCA components and Bonferroni corrected across a total of 25 CCAs performed, see Supplementary file 1a and b for the full set of results). CCA estimates the highest possible ruv given the dataset; therefore, the null distribution for low-dimensional brain data (e.g. ICA 25 amplitude) is expected to be lower than for high-dimensional brain data. (B) Set of non-imaging variables that correlate most strongly with the CCA mode (averaged subject weights V across results marked with * in A; i.e. p=0.00001) with behavioural variables. Position against the y-axis and font size indicate strength of correlation.


