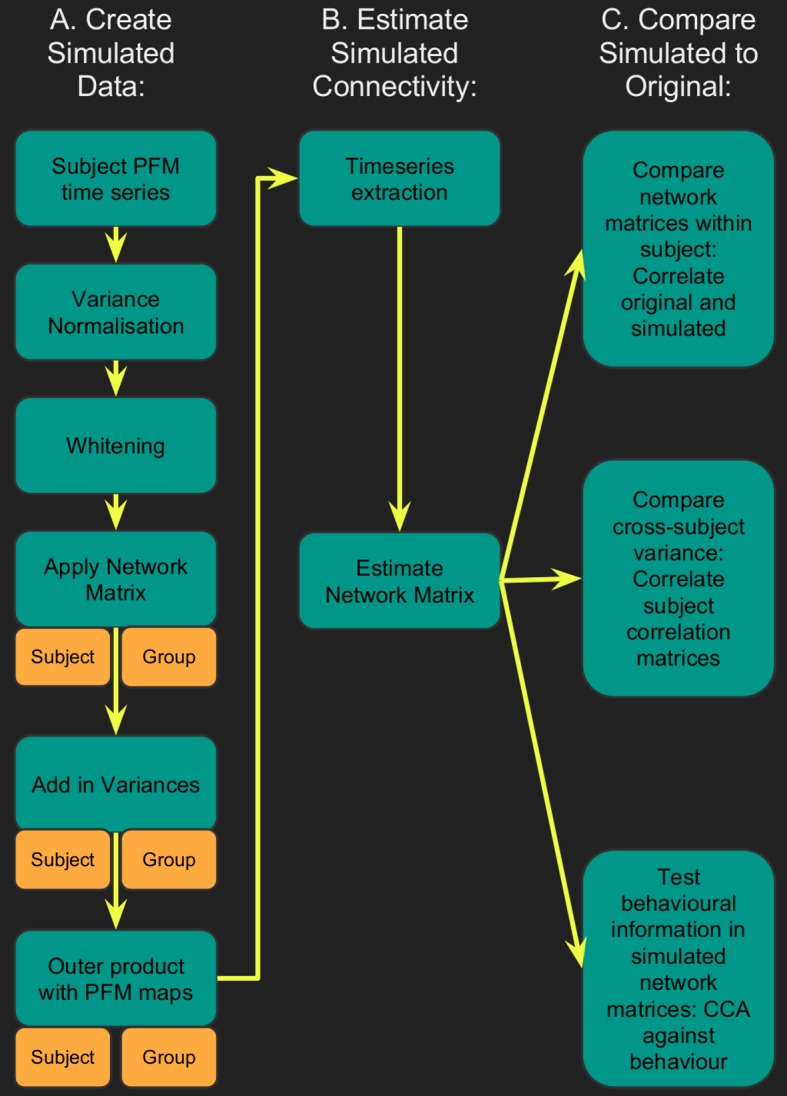
Figure 3. Flowchart for spatiotemporal simulations.

Simulated data was generated for each subject by setting one or more aspects (from the network matrices, node amplitudes, and spatial maps) to the group average. Timeseries extraction is performed (uinsg either dual regression against original group ICA maps, or masked against a binary parcellation); network matrices are calculated and compared against network matrices estimated from the original data.
