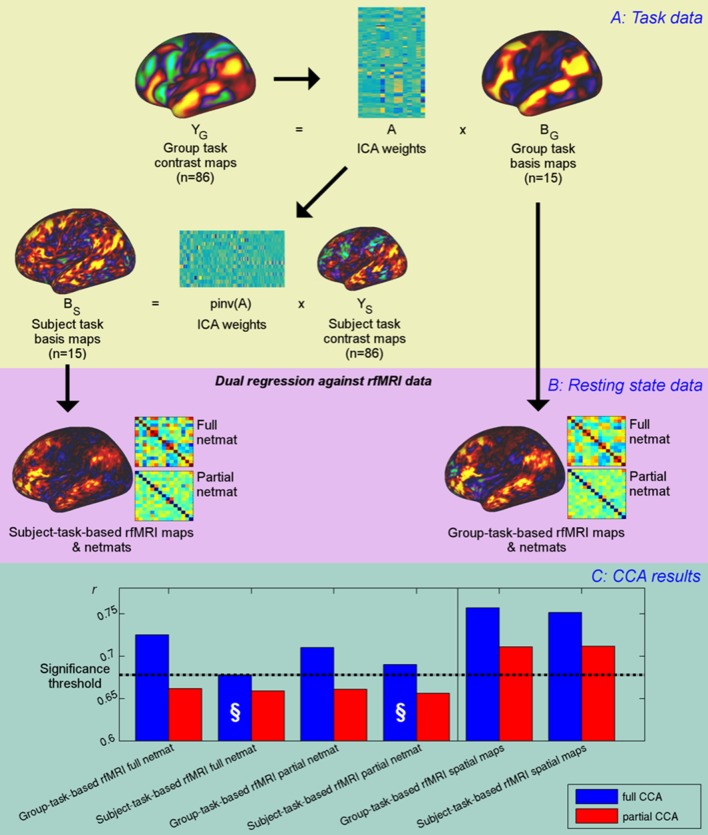
Figure 4. Unique contribution of topography versus coupling.
(A) Task basis maps are extracted from group-averaged task contrasts (n=86, 47 unique) using ICA to ensure correspondence of basis maps across subjects. These maps represent the basic building blocks of any activation pattern, and subject task basis maps (obtained by applying the ICA weights to subject task contrast maps) are not influenced by misalignment problems. (B) Dual regression against rfMRI data is performed using either the (potentially misaligned) group task basis maps or the (functionally localised) subject task basis maps. (C) CCA results of group-task-based rfMRI maps and network matrices and of subject-task-based rfMRI maps and netmats. The results show rUV (i.e., the correlation between the first U and V obtained from the CCA analysis describing the strength of association between the rfMRI and behavioural measures). The null line (i.e., p=0.05 based on permutation testing) is shown as a dotted line at 0.68; results below this line do not reach significance. The blue bars show the main CCA results using the complete data, and the red bars show partial CCA results computed after regressing out any variance that can be explained by network matrices from the spatial maps and vice versa prior to running the CCA. The results show a general decrease in rUV for all measures when comparing partial to full CCA results. The strongest partial CCA result (red bars on right) are found when using rfMRI spatial maps, and the associated netmats showed the weakest results (“§”). However, the partial CCA results for the spatial maps (i.e., the red bars on the right) still reach significance. All of the partial CCAs also showed lower rU-Uica compared to the full CCAs (not shown here).


