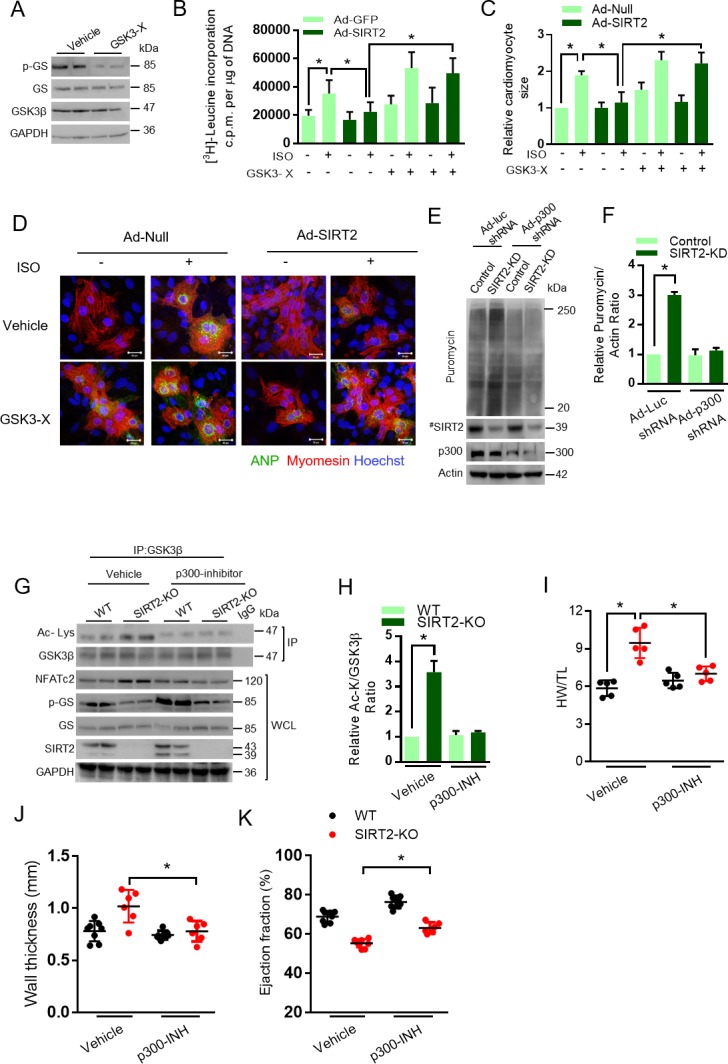
Figure 5. GSK3β is required for the anti-hypertrophic role of SIRT2 deacetylase.
(A) Western blotting analysis depicting the activity of GSK3 inhibitor X (GSK3-X). Neonatal rat cardiomyocytes were treated with vehicle or 500 nM GSK3-X for 48 hr and the activity of GSK3 was assessed by monitoring the phosphorylation of GS by specific antibody. (B) [3H]-leucine incorporation into total cellular protein of control (Ad-GFP) or SIRT2-overexpressing (Ad-SIRT2) rat neonatal cardiomyocytes treated with either vehicle or 500 nM GSK3 inhibitor X (GSK3-X) for 48 hr. Cardiomyocytes were infected with adenoviral vectors encoding either GFP or SIRT2 for 24 hr prior to GSK3-X treatment. After the GSK3-X treatment, cardiomyocytes were stimulated with either vehicle or 20 µM ISO for 24 hr and the [3H]-leucine incorporation was monitored. c.p.m. counts per minute. n = 10. Data is presented as mean ± s.d. *p<0.05. Two-way ANOVA was used to calculate the p values. (C) Histogram showing quantification of relative cardiomyocyte area in control (Ad-Null) and SIRT2-overexpressing (Ad-SIRT2) rat neonatal cardiomyocytes treated with either vehicle or 500 nM GSK3 inhibitor X (GSK3-X) for 48 hr. Cardiomyocytes were infected with adenoviral vectors encoding either control or SIRT2 for 24 hr prior to GSK3-X treatment. After the GSK3-X treatment, cardiomyocytes were stimulated with either vehicle or 20 µM ISO for 24 hr and the relative cardiomyocyte area is quantified as described in Materials and methods section. Data is presented as mean ± s.d. *p<0.05. Two-way ANOVA was used to calculate the p values. (D) Representative confocal images depicting perinuclear expression of ANP in control (Ad-Null) or SIRT2-overexpressing (Ad-SIRT2) cardiomyocytes treated with either vehicle or ISO (20 µM, 24 hr), with or without GSK3 inhibitor X (GSK3-X, 500 nM, 48 hr). Scale bar = 20 µm. ANP (Green), Myomesin (Red), Hoechst (Blue). (E) Western blotting analysis for puromycin incorporation in control or SIRT2-depleted (SIRT2-KD) neonatal rat cardiomyocytes infected with adenovirus expressing either control (Ad-luc shRNA) or p300 shRNA (Ad-p300-shRNA) 48 hr. p300 depletion was confirmed by western blotting. Pulse of puromycin was given 30 min prior to harvesting of cardiomyocytes and puromycin incorporation into nascent proteins was tested using anti-puromycin antibody. # marked Western images denotes SIRT2 antibody used in this assay detects single band. (F) Histogram showing relative puromycin levels in control or SIRT2-depleted (SIRT2-KD) cardiomyocytes infected with adenovirus expressing either control (Ad-luc shRNA) or p300 shRNA (Ad-p300-shRNA). The data is generated from Figure 5E. Signal intensities of puromycin and actin were measured by densitometry analysis using ImageJ software. n = 3 independent experiments. Data is presented as mean ± s.d. *p<0.05. Two-way ANOVA was used to calculate the p values. (G) Western blotting analysis of GSK3β acetylation and activity in heart lysates of vehicle or anacardic acid (p300 inhibitor) treated 9 months old WT and SIRT2-KO mice littermates. Anacardic acid was injected intraperitoneal at the dose of 5 mg/kg/day for 10 days in mice. Peanut oil was used as vehicle. GSK3β was immunoprecipitated from heart lysates of WT and SIRT2-KO mice using anti-GSK3β antibody (sc-9166, Santa Cruz Biotechnology), and the affinity resin with protein A/G immobilized. Western blotting was performed to detect GSK3β acetylation by anti-Ac-Lysine antibody. GSK3β activity was measured by detecting the phosphorylation of GS. SIRT2 depletion was confirmed by western blotting. Whole cell lysates (WCL) was probed for indicated proteins by western blotting. (H) Histogram showing relative GSK3β acetylation in heart lysates of vehicle or anacardic acid (5 mg/kg/day for 10 days) treated 9 months old WT and SIRT2-KO mice from Figure 5G. n = 3. Signal intensities of GSK3β and acetylated-GSK3β was measured by densitometry analysis using ImageJ software. Data is presented as mean ± s.d. *p<0.05. Two-way ANOVA was used to calculate the p values. (I) Scatter plot depicting HW/TL ratio of 9 months old WT and SIRT2-KO mice treated with either vehicle or anacardic acid, (p300-INH), at the dose of 5 mg/kg/day for 10 days. n = 5 mice per group. Data is presented as mean ± s.d. *p<0.05. Two-way ANOVA was used to calculate the p values. (J) Scatter plot showing left ventricular posterior wall thickness of 9 months old WT and SIRT2-KO mice treated with either vehicle or anacardic acid (p300-INH), at the dose of 5 mg/kg/day for 10 days. n = 6–8 mice per group. Data is presented as mean ± s.d. *p<0.05. Two-way ANOVA was used to calculate the p values. (K) Scatter plot depicting cardiac contractile functions, as measured by ejection fraction of 9 months old WT and SIRT2-KO mice treated with either vehicle or anacardic acid (p300-INH), at the dose of 5 mg/kg/day for 10 days. n = 6–8 mice per group. Data is presented as mean ± s.d. *p<0.05. Two-way ANOVA was used to calculate the p values.

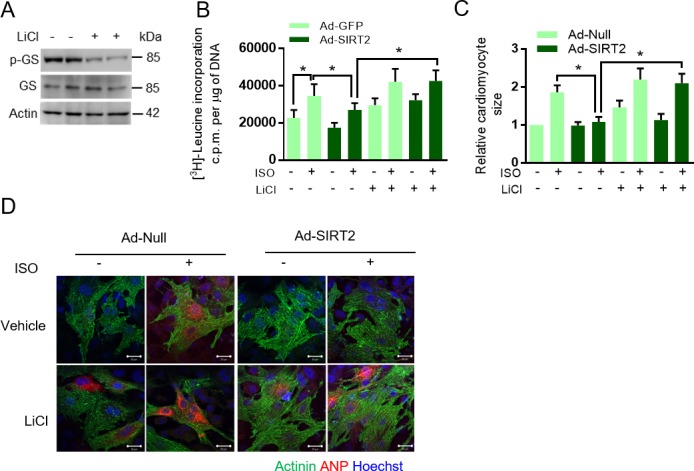
Figure 5—figure supplement 1. GSK3 inhibition abrogates anti-hypertrophic role of SIRT2 deacetylase.

