
Fig. 3. Seven- to eight-residue macrocycle NMR structures are very close to design models.
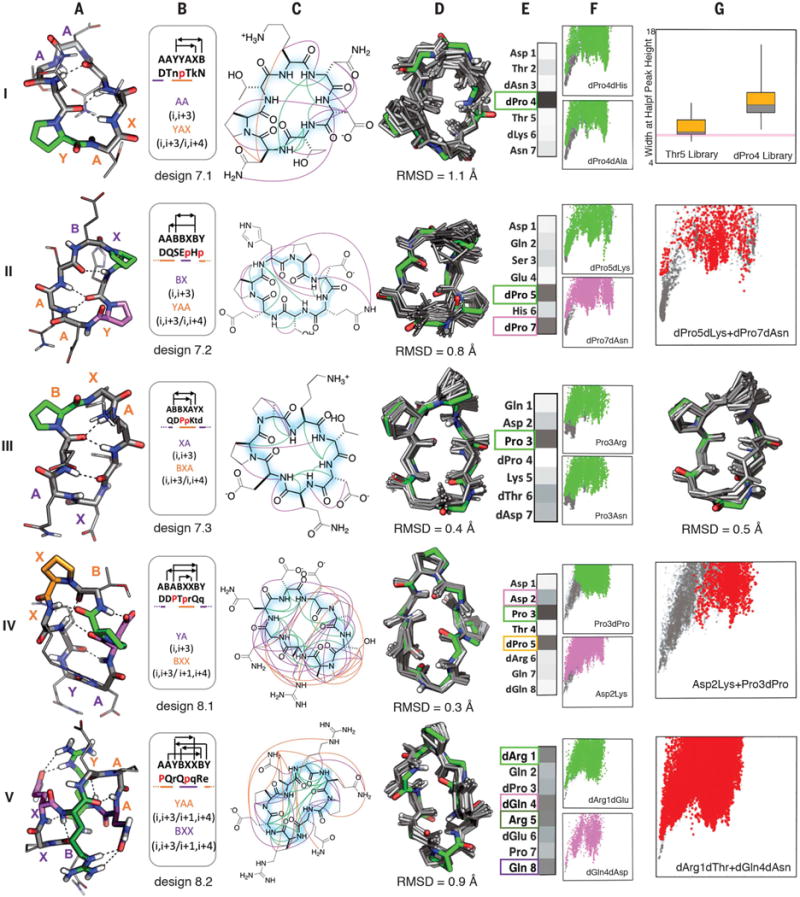
Columns A: Design model. B: Amino acid sequence, torsion bin string, hydrogen bond pattern, and building block composition. C: Observed backbone-backbone (green), backbone–side-chain (purple), and side-chain–side-chain (orange) NOEs. D: Overlay of design model (green) on MD-refined NMR ensemble (gray; the average backbone RMSD to the NMR ensemble is indicated). E: Average decrease in the propensity to favor the designed state (PNear, see methods) over all mutations at each position. Darker gray indicates larger decreases (PNear values for each substitution at each position are in fig. S16); positions particularly sensitive to mutation are boxed and indicated by color in the design model in column A. F: Representative energy funnels for mutations at key positions (colored points) as compared to the design sequence (gray points). Row I, column G: Experimental SLIM data. Distribution of peak width at half height for peptide libraries with all amino substitutions at positions 4 and 5; the position 4 library has a broader distribution consistent with the computed energy landscape in column F. Rows II, IV, V, column G: Representative energy landscapes for double substitutions (red) of critical residues overlaid on the original design landscape (gray). Row III, column G: Overlay of design model on alternative structure NMR ensemble (turn flip at bottom right).