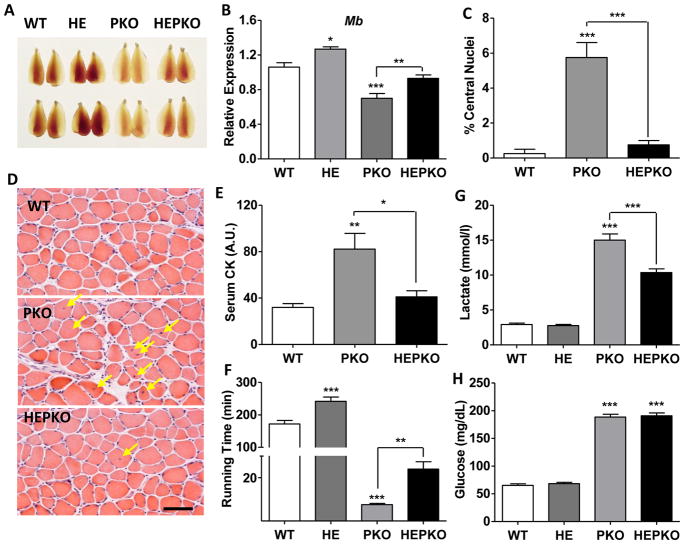
Figure 1. ERRγ improves running defect and muscle damage in PGC1-null mice.
(A) Images of Tibialis anterior (TA) muscle from wild-type (WT), ERRγ transgenic (HE), muscle-specific PGC1α/β knockout (PKO), and HEPKO mice; (B) Relative expression of Myoglobin (Mb) in plantaris muscle; (C–D) Percentage centralized-nuclei in muscle and representative H&E staining (E) serum creatine kinase (CK) levels in sedentary mice; (F) running time during low-speed endurance test; (G) blood lactate levels after 6 minutes of endurance running (upon failure of the first mouse); and (H) blood glucose level at failure in endurance test. n=5. Data represent mean ± SEM, *p < 0.05, **p < 0.01, ***p < 0.001. Scale bar, 50μm. See also Figure S1.

