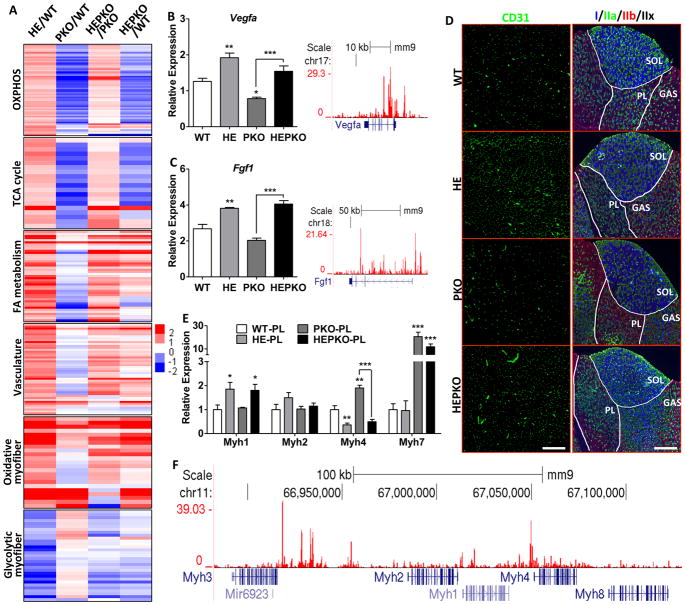
Figure 3. ERRγ induces oxidative muscle remodeling independent of PGC1.
(A) Heat maps showing relative changes in expression of selected genes involved in OXPHOS, TCA cycle, FAO, vasculature, oxidative-specific myofiber, and glycolytic-specific myofiber in plantaris; (B–C) Relative expression of Vegfa and Fgf1 in plantaris (left) and genome browser tracks showing ERRγ binding (right); (D) Immunostaining of CD31 for vasculature (left) and Myh I/IIa/IIb for fiber-typing (right); (E) Relative expression of Myh1/2/4/7 in plantaris; and (F) genome browser track showing ERRγ binding at the Myh cluster locus. n=5. Data represent mean ± SEM, *p < 0.05, **p < 0.01, ***p < 0.001. Scale bars, 300μm (CD31) and 750μm (Myh). See also Figure S3.

