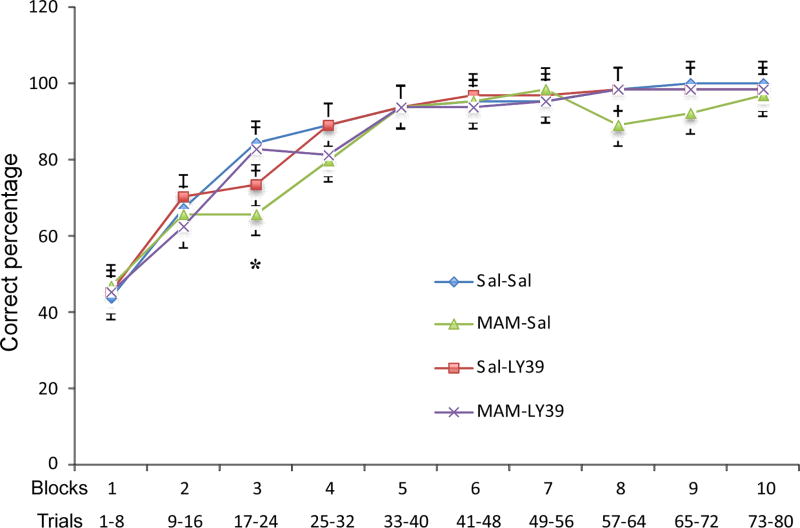
Figure 6.
A summary graph of correct percentage in each block in Set 2 of the cross-maze. Set 2 contains 10 blocks, and each block contains 8 trials. MAM-Saline animals showed significantly lower correct percentage compared with Saline-Saline animals in block 3 (n=8 for each group, *p<0.05). No significant differences were found in other blocks among all groups (p>0.05).

