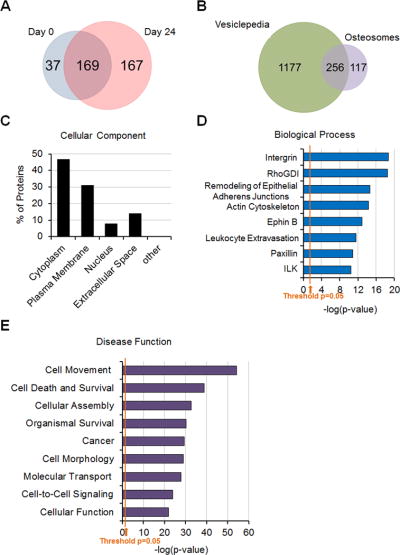
Figure 3.
Proteomics analysis of osteosomes. (A) Venn diagram of proteins in D0 vs D24 osteosoms. (B) Venn diagram of proteins in osteosomes and in Vesiclepedia. (C) Ingenuity Pathway Analysis of the intracellular origin of osteosome proteins. (D) The involvement of osteosome proteins in various biological processes. (E) The involvement of osteosome proteins in disease functions. These pathways are selected based on p values (expressed as −log(p-value)). The marked thresholds in D and E represent p=0.05.

