
Figure 5.
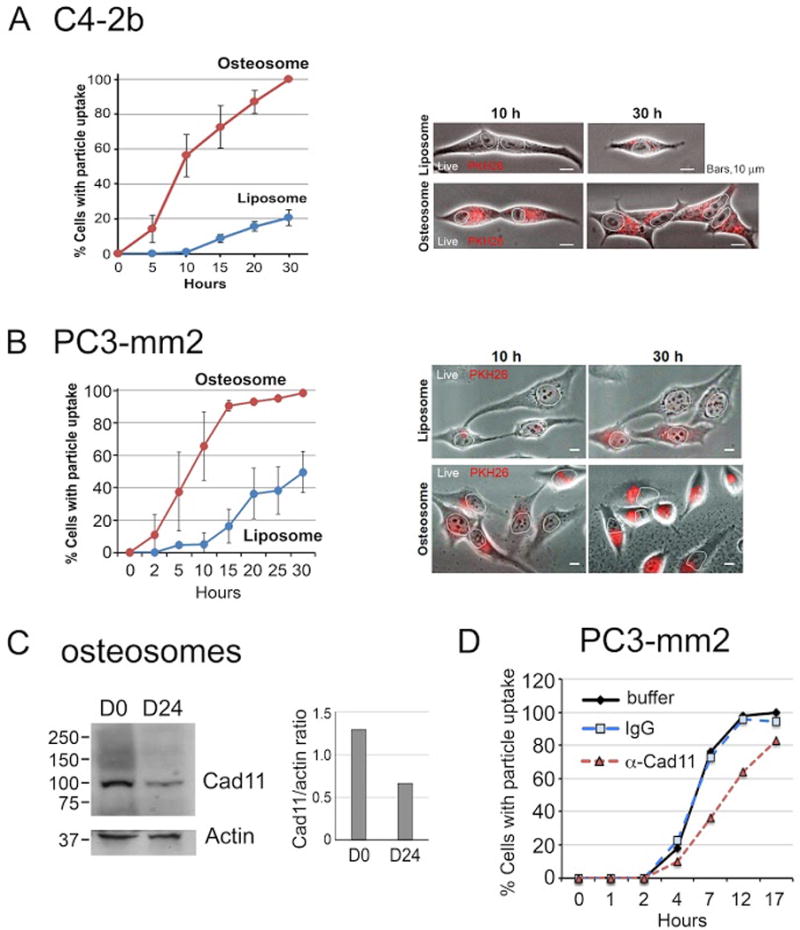
Osteosome uptake into C4-2b and PC3-mm2 cells. Live-cell imaging of osteosome uptake in (A) C4-2b cells and (B) PC3-mm2 cells. Cells (1×10⁴) were incubated with PKH26-labeled D24 osteosomes or PKH26-labeled control liposomes (3×10⁵ particles). Live-cell imaging was recorded at 30 min intervals over 30 h on a Nikon Biostation. Number of cells imaged live: C4-2b with osteosome (n=157) or liposome (n=48); PC3-mm2 with osteosome (n=118) or liposome (n=100) in two independent experiments. Error bars, mean ± s.d. Right panels, representative bright field images merged with PKH26 red fluorescence of cells treated with PKH26-labeled liposomes or PKH26-labeled osteosomes. Nuclei are outlined; dash line separates two cells. Bars, 10 μm. (C) Western blot of adhesion molecule cadherin-11 (Cad11) in D0 and D24 osteosomes. Right panel, quantification of Cad11 level. (D) Live-cell imaging of PC3-mm2 was performed as in B, except that PKH26-labeled osteosomes were preincubated with either anti-Cad11 mAb 1A5, isotype-matched irrelevant mAb (IgG), or PBS buffer, prior to their addition to cells. The final antibody concentration was 3 μg/ml. Number of cells imaged live following osteosome pre-incubation with: PBS (n=55), IgG (n = 52), and Cad11 mAb (n=81).