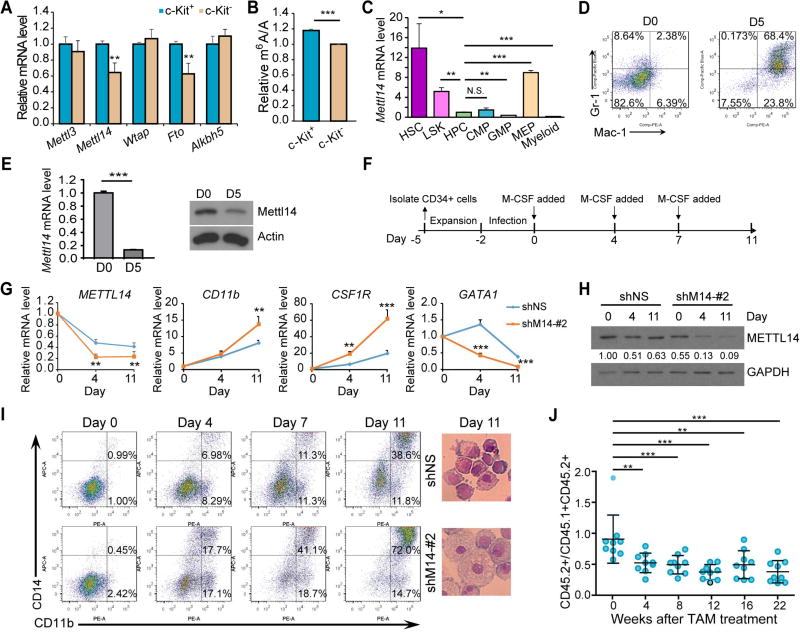
Figure 1. Impact of METTL14 on normal myeloid differentiation.
(A,B) Expression of individual m6A modifiers (A) and global m6A levels in mRNA (B) in c-Kit+ and c-Kit− BM cells from wildtype C57BL/6 mice (n=3), as detected by qPCR and LC-MS/MS, respectively.
(C) Relative expression of Mettl14 in different sub-populations of BM cells from wildtype C57BL/6 mice as detected by qPCR. Expression of Mettl14 in HPCs was set as 1.
(D) C57BL/6 Lin− HSPCs were co-cultured with OP9 cells in vitro for 5 days and subjected to flow cytometric analysis.
(E) OP9 co-cultured cells were subjected to qPCR (left) and western blot (right) analysis for the expression of Mettl14.
(F) Schematic diagram showing the procedure of inducing human CD34+ HSPCs toward monocyte/macrophage differentiation. Note that the day when M-CSF was first added to induce differentiation was set as day 0.
(G) qPCR showing changes of METTL14, CD11b, CSF1R, and GATA1 during differentiation in the control (shNS) and METTL14-depleted (shM14-#2) groups.
(H) Western blot showing expression changes of METTL14 during differentiation. Signal of METTL14 was quantified and normalized to that of GAPDH.
(I) In vitro induced human CD34+ cells were stained at the indicated time points and subjected to flow cytometric analysis (left). Wright-Giemsa staining of cells collected at day 11 was shown on right.
(J) In vivo competition assays.
Mean±SD values are shown for Figures 1A, B, C, E (left panel), G, and J. *, p < 0.05; **, p <0.01; ***, p < 0.001; N.S., non-significant; t-test. See also Figure S1.

