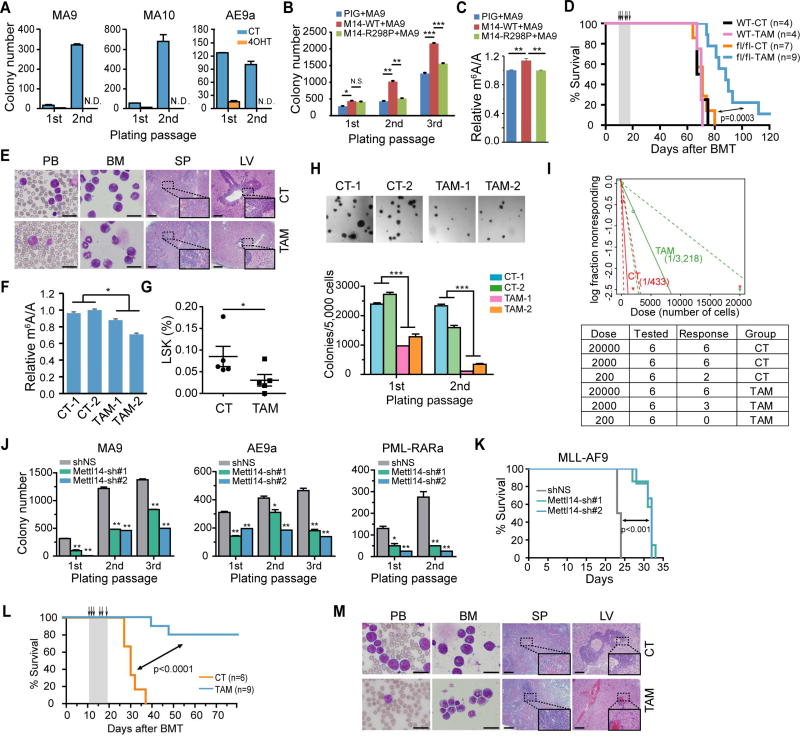
Figure 3. METTL14 plays a critical role in AML development and maintenance.
(A) Lin− BM cells from Mettl14fl/fl-CREERT mice were transduced with MSCVneo-MLL-AF9 (MA9), -MLL-AF10 (MA10), or -AML1-ETO9a (AE9a) retroviruses and seeded onto methylcellulose medium for CFA assays. 4-OHT at a final concentration of 1 µM was added to the methylcellulose medium at the first round of plating. N.D., non-detectable.
(B) Lin− BM cells from wildtype CD45.1 mice were transduced with MSCVneo-MLL-AF9 (MA9) plus MSCV-PIG (PIG), MSCV-PIG-METTL14-WT (M14-WT), or MSCV-PIG-METTL14-R298P (M14-R298P) retroviruses, and seeded for CFA assays.
(C) Cells collected from the 2nd round of plating in Figure 3B were subjected to mRNA extraction following by LC-MS/MS for detection of global m6A changes.
(D) Kaplan–Meier curves showing the effect of METTL14 knockout on MLL-AF9-induced primary leukemogenesis. BMT recipient mice were treated with vehicle (CT) or tamoxifen (TAM) for five consecutive days as indicated with arrows.
(E) Wright–Giemsa staining of peripheral blood (PB) and BM, and hematoxylin and eosin (H&E) staining of spleen (SP) and liver (LV) of the primary fl/fl BMT recipient mice at the end point. Bar= 20 µm (for PB and BM) or 200 µm (for SP and LV).
(F) LC-MS/MS detection of global m6A changes in mRNA of BM cells (a mixture of fully or partially Mettl14 depleted AML cells and normal BM cells) isolated from fl/fl recipient mice in Figure 3D.
(G) Percentage of LSK cells in the BM of primary leukemic fl/fl BMT mice treated with vehicle (CT) or tamoxifen (TAM) as determined by flow cytometry.
(H) CFA assays of BM cells harvested from primary leukemic fl/fl BMT mice (2 mice/group). Representative images of the colonies after the first round of plating were displayed on top, while the numbers of colonies were shown at the bottom.
(I) Limiting dilution assays using BM leukemia cells from primary fl/fl BMT mice. The estimated LSC/LIC frequency was shown on the plot. Dose, number of donor cells; tested, total number of mice used as BMT recipients in the assay; response, mice developed leukemia within 4 weeks post BMT.
(J) BM cells from MA9, AE9a, and PML-RARa leukemia mice were transduced with Mettl14 shRNAs and subjected to CFA assays.
(K) Kaplan–Meier curves showing the effect of Mettl14 knockdown on the maintenance/progression of MA9-induced AML in secondary BMT recipient mice.
(L,M) Effect of Mettl14 knockout on the progression of MA9-induced AML in secondary BMT recipient mice. Recipient mice were divided randomly into two groups and treated with vehicle (CT) or tamoxifen (TAM) at the indicated time points (see arrows). Kaplan–Meier curves were shown in (L). Wright-Giemsa stained PB and BM, and H&E stained spleen and liver of the secondary BMT recipient mice at the end point were shown in (M). Bar= 20 µm (for PB and BM) or 200 µm (for SP and LV).
Mean±SD values are shown for Figures 3A, B, C, F, G, H (lower panel), and J. *, p < 0.05; **, p <0.01; ***, p < 0.001; N.S., non-significant; t-test (for Figures 3B, 3G, 3H, and 3J) or log-rank test (for Figures 3D, 3I, and 3L). See also Figure S3.

