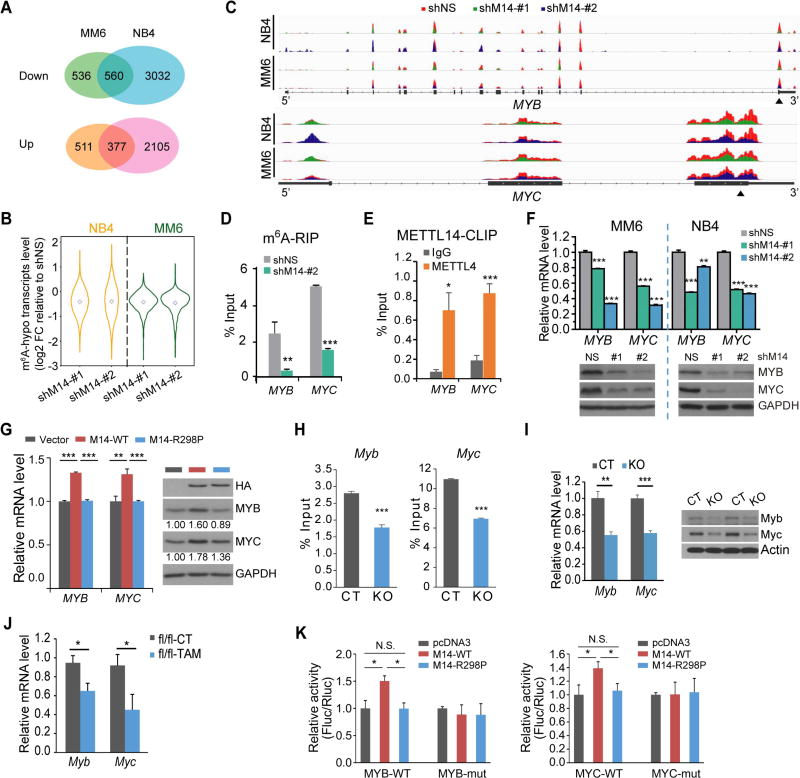
Figure 5. Transcriptome-wide identification of METTL14 targets.
(A) Venn diagram showing numbers of genes with significant changes in expression (p<0.05; fold change ≥1.2) upon METTL14 knockdown.
(B) Expression changes of mRNA transcripts with decreased m6A abundance (m6A-hypo) upon METTL14 knockdown in METTL14 silenced (shM14-#1 and shM14-#2) cells relative to control cells. Note that the fold changes (FC) were log2 transformed.
(C) The m6A abundances on MYB and MYC mRNA transcripts in METTL14-knockdown and control MM6 and NB4 cells as detected by m6A-seq. Solid triangles indicate regions for qPCR in (D) and (E).
(D) Reduction of m6A modification in specific regions of MYB and MYC transcripts upon METTL14 knockdown as tested by gene-specific m6A-qPCR assay in MM6 cells.
(E) CLIP-qPCR showing the association of MYB and MYC transcripts with METTL14 in MM6 cells.
(F) qPCR (upper) and western blot (lower) showing decrease of MYB and MYC expression after knockdown of METTL14 in AML cell lines.
(G) qPCR (left) and western blot (right) showing increase of MYB and MYC expression in U937 cells with ectopic expression of wildtype (M14-WT) but not mutated (M14-R298P) METTL14.
(H,I) Gene-specific m6A-qPCR (H) and qPCR/western blot (I) showing decrease of m6A modification in specific region of Myb or Myc transcripts and expression changes of Myb or Myc mRNA/protein, respectively, in c-Kit+ BM of Mettl14fl/fl-CREERT mice treated with TAM (KO) as compared to those treated with oil (CT).
(J) Expression changes of Myb and Myc mRNA in c-Kit+ BM of leukemic fl/fl BMT mice from Figure 3D.
(K) Dual luciferase reporter assays showing the effect of METTL14 on MYB/MYC reporters with either wild-type or mutated m6A sites.
Mean±SD values are shown for Figures 5D–K. *, p < 0.05; **, p <0.01; ***, p < 0.001; t-test. See also Figure S5.

