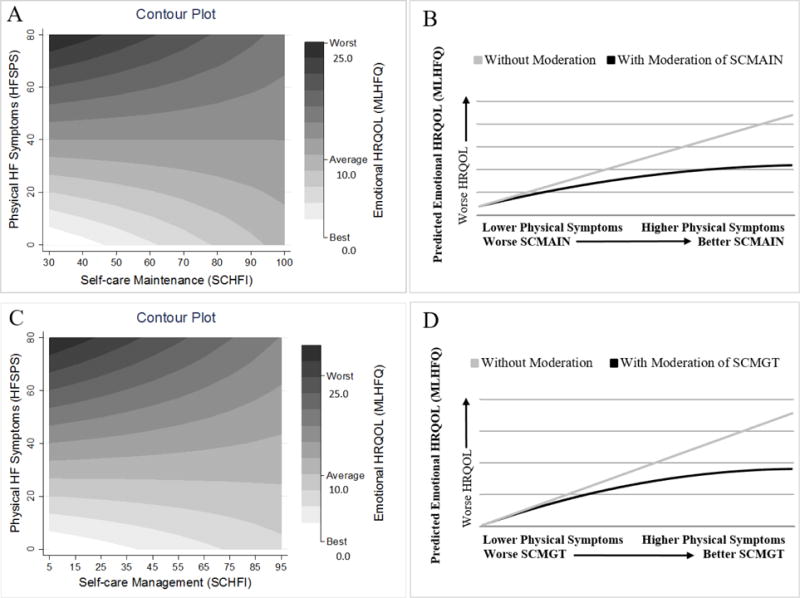
Figure 2. Self-care as a Moderator of Physical Symptoms and Emotional HRQOL.

Plots A & C: The contour plots show that emotional HRQOL was dependent upon both the level of physical symptoms and self-care (maintenance and management) at all levels. For example, the best emotional HRQOL (white color) was reported when both symptoms and self-care are low, and the worst emotional HRQOL (black color) was reported when symptom were high but self-care was low. Plots B & D: Linear regression was used to estimate emotional HRQOL with and without the moderation of self-care (maintenance and management) on the relationship between physical symptoms and emotional HRQOL. The better the self-care, the less physical symptoms affect emotional HRQOL. Note: Plots B & D represent a simplified moderation for economy of presentation whereas Plots A & C represent the full complexity of moderation.
Abbreviations: HFSPS – Heart Failure Somatic Perceptions Scale; HRQOL – health-related quality of life; MLHFQ – Minnesota Living with Heart Failure Questionnaire; SCMAIN – self-care Maintenance; SCMGT – self-care Management.
