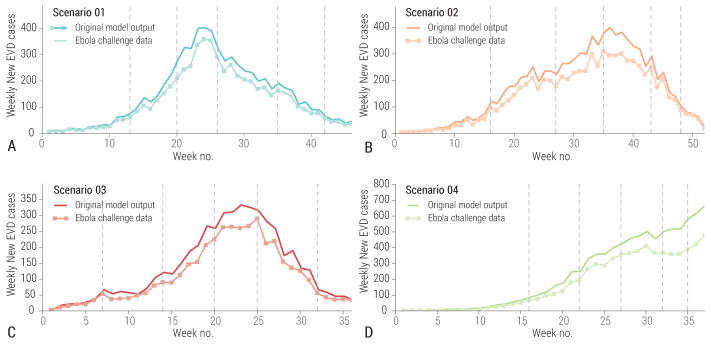
Figure 5.
Weely number of cases in the original model output and as provided for the challenge after adding noise and underreporting. A Scenario 1. B Scenario 2. C Scenario 3. D Scenario 4. Vertical lines indicate the 5 data release dates of each scenario, corresponding to 5 prediction times points.

