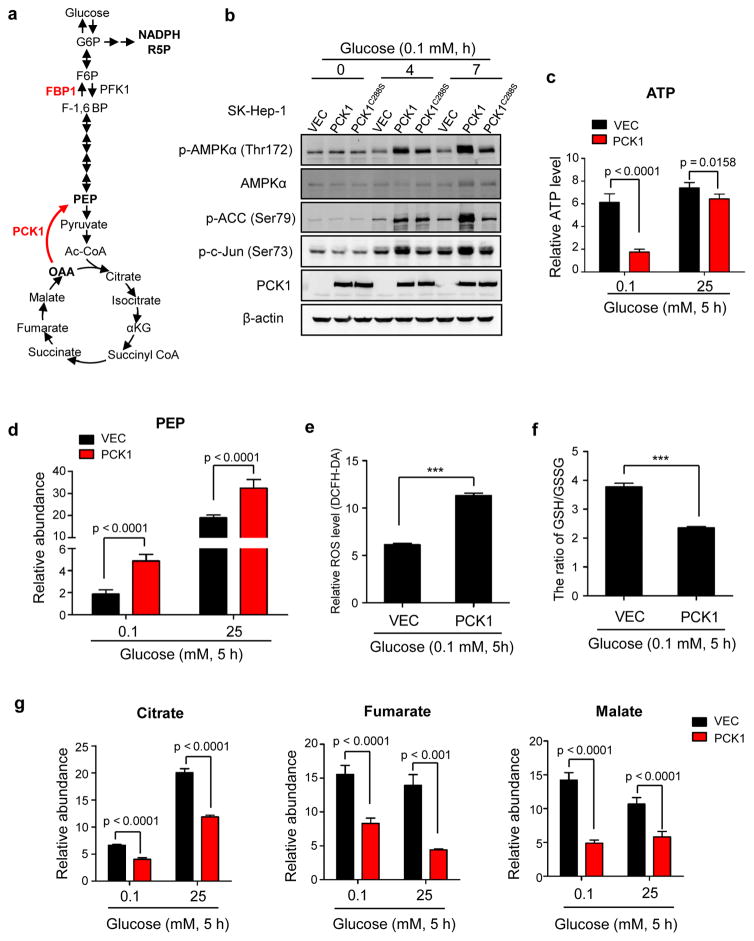
Figure 4. PCK1 induced TCA cataplerosis, energy crisis and oxidative stress in liver cancer cells.
(a) A diagram illustrating the reactions catalyzed by PCK1 in regulating TCA cycle and gluconeogenesis. PFK1, phosphofructokinase1; FBP1, fructose-1,6-bisphosphatase 1. G6P, glucose 6-phosphate; F6P, fructose 6-phosphate; F-1,6-BP, fructose 1,6-bisphosphate; PEP, phosphoenolpyruvate; R5P, ribose 5-phosphate; OAA, oxaloacetate; α-KG, α-ketoglutarate. (b) PCK1 activated AMPKα1 in glucose-deprived cells. SK-Hep-1 cells expressing empty vector, wildtype or mutant PCK1 were cultured in media containing 0.1 mM of glucose for the durations indicated. Phospho-AMPKα1 (Thr172), phospho-ACC (Ser79) and phospho-c-Jun (Ser73) were examined by Western blotting. (c) Ectopic expression of PCK1 decreased cellular ATP level in glucose starved cells. SK-Hep-1 cells expressing empty vector or PCK1 were cultured in media containing 0.1 mM or 25 mM of glucose for 5 h, followed by measurement of cellular ATP level as described in Methods. Values represent mean ATP levels ± SD of quintuplicate samples (*p < 0.05, ***p < 0.001). (d) Relative abundance of PEP was increased in cells ectopically expressing PCK1. SK-Hep-1 cells expressing empty vector or PCK1 were cultured under conditions as described in (c). Relative abundance of cellular PEP was determined by LC-MS. Values represent mean PEP levels ± SD of quintuplicate samples (***p < 0.001). (e) Ectopic expression of PCK1 resulted in higher ROS level. SK-Hep-1 cells expressing empty vector or PCK1 were cultured in media containing 0.1 mM of glucose for 5 h. ROS level was detected by DCFH-DA staining as described in Methods. Values represent mean ROS level ± SD of triplicate samples (***p < 0.001). (f) Ectopic expression of PCK1 reduced GSH/GSSG ratio. SK-Hep-1 cells expressing empty vector or PCK1 were cultured under conditions described in (e). Cellular levels of GSH and GSSG were determined by LC-MS. Values represent mean ratios of GSH/GSSG ± SD of quadruplicate samples (***p < 0.001). (g) Relative abundance of citrate, malate and fumarate was significantly decreased in cells ectopically expressing PCK1. SK-Hep-1 cells expressing empty vector or PCK1 were cultured under conditions as described in (c). GC-MS was performed to detect the cellular levels of these metabolites. Values represent mean abundance of indicated metabolites ± SD of quintuplicate samples (***p < 0.001).

