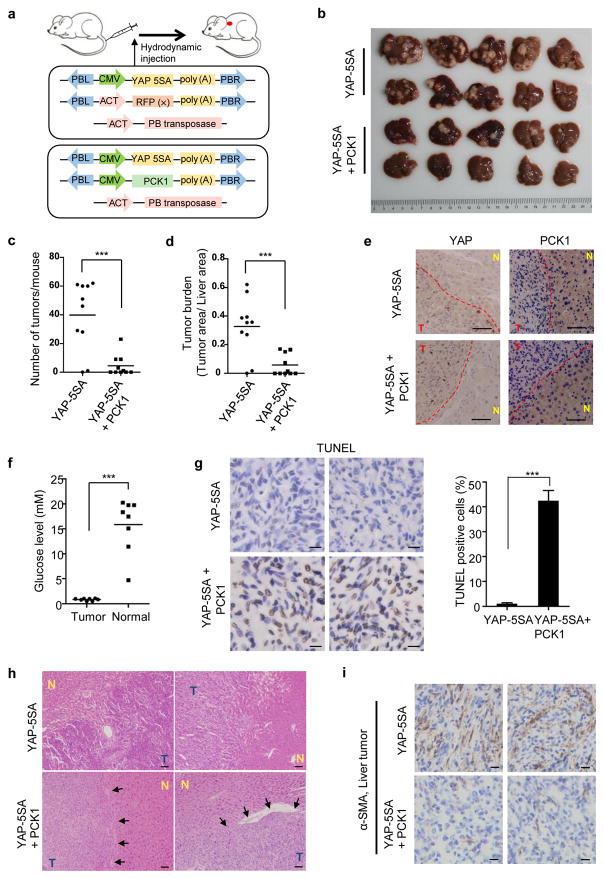
Figure 6. PCK1 suppresses liver tumorigenesis in vivo.
(a) Schematic of liver tumorigenesis model by the hydrodynamic injection. Transposon plasmid encoding YAP(5SA) and either vector or PCK1 were mixed at a ratio of 1:2, and were delivered into mice by hydrodynamic injection together with piggyBac transposase. (b–d) Ectopic expression of PCK1 significantly suppressed YAP(5SA) induced liver tumorigenesis. Mice were sacrificed at 4 months after hydrodynamic injection, and livers were collected and photographed (b). Tumor numbers (c) were counted and liver tumor area (d) was calculated using ImageJ software. The horizontal bars represent mean tumor numbers (c) and mean tumor area (d) of ten mice within each group (***p < 0.001). (e) Representative IHC staining of YAP and PCK1 of mice livers from each group. Dashed lines separate tumor tissues from adjacent normal liver tissues. Scale bars: 50 μm. T: liver tumor; N: adjacent normal liver tissue. (f) The glucose concentration in interstitial fluid of eight primary mouse liver tumors and normal, adjacent liver tissues (***p < 0.0001). (g) Much higher percentage of TUNEL positive cells was shown in liver tumors developed in mice co-injected with YAP(5SA) and PCK1 than tumors developed in mice injected with YAP(5SA) (***p < 0.001). Two representative IHC staining of TUNEL in each group were shown. Scale bars: 10 μm. (h) Histological diagnosis of HCC by H&E staining showed significant pathological differences between livers injected with YAP(5SA) and YAP(5SA)/PCK1. Arrows show representative capsules in H&E slides of livers co-injected with YAP(5SA) and PCK1, which separated tumor from adjacent normal liver tissue. Scale bars: 50 μm. T: liver tumor; N: adjacent normal liver tissue. (i) Much more severe fibrosis was shown in liver tumors developed in mice injected with YAP(5SA) than tumors developed in mice co-injected with YAP(5SA) and PCK1. Two representative IHC staining of α-smooth muscle actin (α-SMA) in each group were shown. Scale bars: 50 μm.

