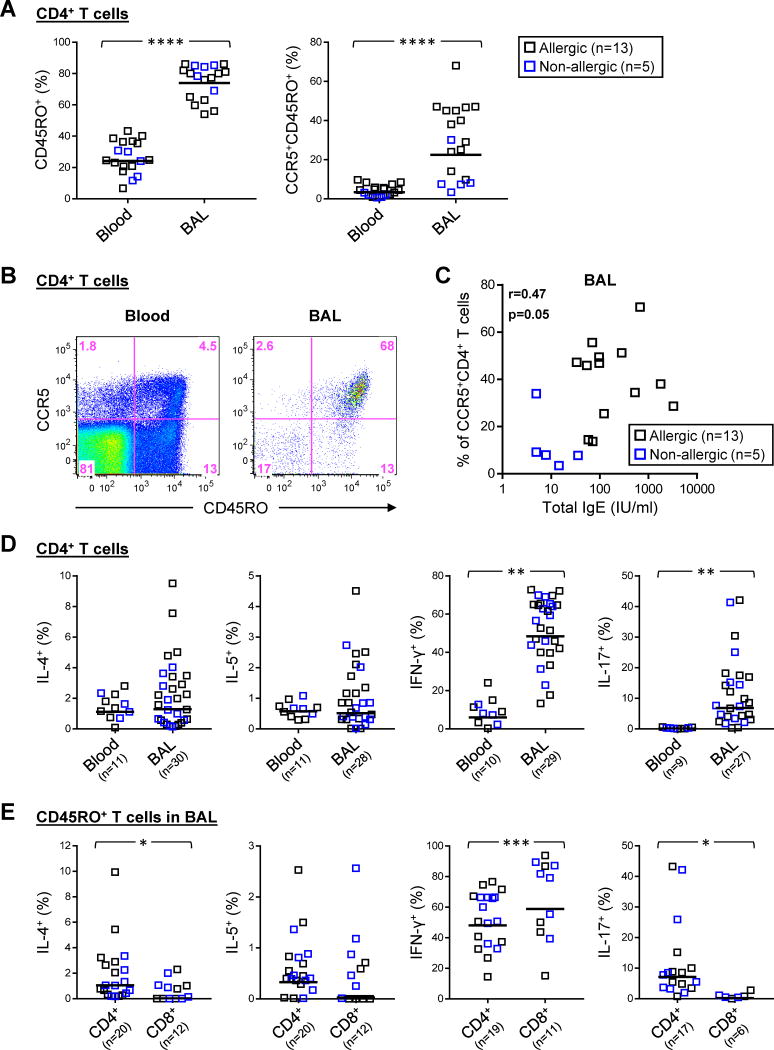
Figure 2. Surface Signature and Intracellular Cytokine Expression in CD4+ T Cells in the Peripheral Blood and BAL Fluid of Children with Severe Asthma.
(A) Comparison of the percentage of total CD4+ T cells expressing CD45RO and CCR5 in blood and BAL fluid specimens obtained within the same subject. Horizontal bars denote geometric mean values. (B) Representative scatter plots showing expression of CD45RO and CCR5 on CD4+ T cells. (C) Correlation between serum total IgE and percentages of CCR5+CD4+ T cells in BAL specimens from asthmatic subjects. (D) The percentage of IL-4+, IL-5+, IFN-γ+ and IL-17+ cells within total CD4+ T cells in BAL fluid compared with blood, based on intracellular cytokine staining. (E) Comparison of cytokine-positive CD4+ and CD8+ T cells within the memory subset in BAL fluid. Horizontal bars denote geometric mean values. *p≤0.05, **p<0.01, ***p<0.001, ****p<0.0001.

