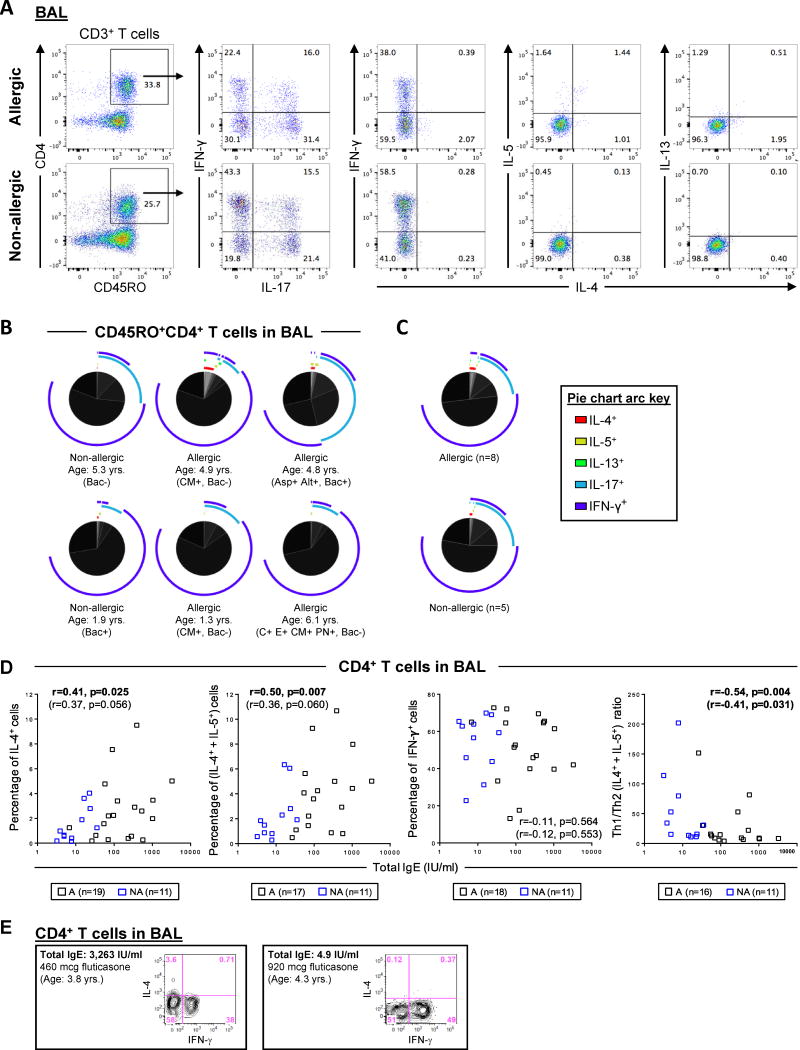
Figure 3. Heterogeneity of Cytokine-Positive CD4+ T Cells in BAL Fluid and Relationship to Serum IgE.
(A) Representative scatter plots showing IL-4+, IL-5+, IL-13+, IL-17A+ and IFN-γ+ cells within the memory CD4+ T-cell subset in BAL fluid. (B) Pie charts comparing the distribution of cytokine positive subpopulations expressing various combinations of IL-4, IL-5, IL-13, IL-17A and IFN-γ within memory CD4+ T cells present in BAL. Pie charts show data from 6 subjects. Each slice of the pie denotes a single T-cell subpopulation within the memory T-cell subset, and different arc colors denote each cytokine expressed within a given subpopulation. Bacterial culture negative (Bac-) or positive (Bac+). Specific IgE to Cat (C) Aspergillus (Asp), Alternaria (Alt), cow's milk (CM), egg (E), and peanut (PN) is indicated. (C) Summary data for 8 allergic and 6 non-allergic subjects. (D) Correlations between serum total IgE and the percentage of CD4+ T cells expressing Th1 or Th2 cytokines, and Th1/Th2 ratio in BAL fluid. Correlation values in parentheses were adjusted for age and inhaled corticosteroid dose. A, allergic; NA, non-allergic. (E) Representative scatter plots from subjects with high and low IgE showing expression of IL-4 and IFN-γ in CD4+ T cells in BAL T cells.

