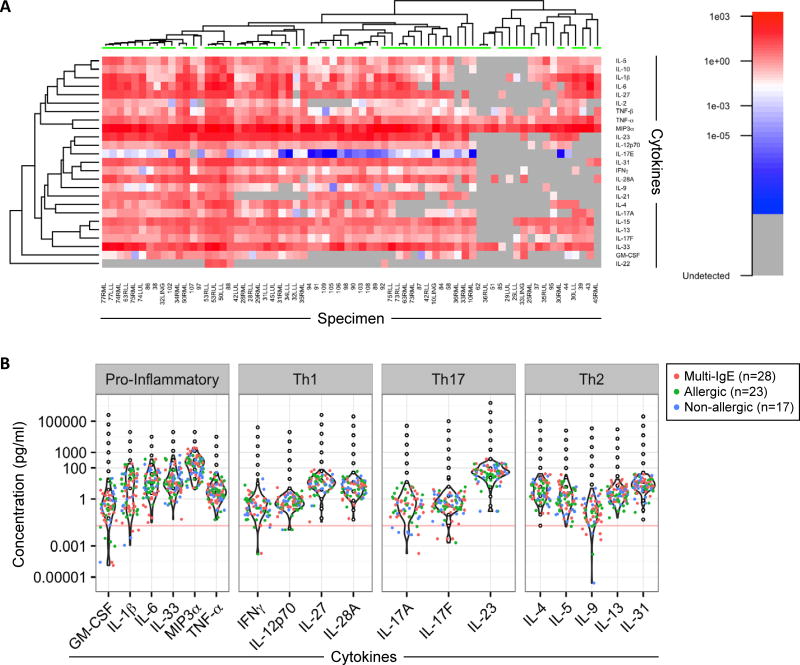
Figure 4. Signatures of Secreted Cytokines in BAL Fluid of Asthmatics.
(A) Heat map of cytokines in BAL fluid from 68 specimens (includes specimens from 2 different lung regions in 20 subjects). LLL, left lower lobe; RLL, right lower lobe; LUL, left upper lobe; RUL, right upper lobe; RML, right middle lobe; LING, lingular lobe. Samples with undetectable levels are shown in grey. Samples with detectable signals below the standard curve are colored blue to white, while samples within standard curve ranges (>0.02 pg/ml) are scaled red. Green bars (top of heat map) denote samples from allergic subjects. (B) Violin plots of cytokine levels for BAL specimens and relationship to the standard curve (black open dots). Each dot corresponds to the “average” concentration for a given subject derived from all observed MFI values run in at least duplicates and interpolated from the standard curve. Red, green and blue dots correspond to BAL specimens from multi-sensitized (IgE to >3 allergens; 18 subjects), allergic (IgE to 1–3 allergens; 16 subjects) and non-allergic (14 subjects) asthmatics respectively. Horizontal line denotes the lowest value of all standard curves (0.02 pg/ml).

