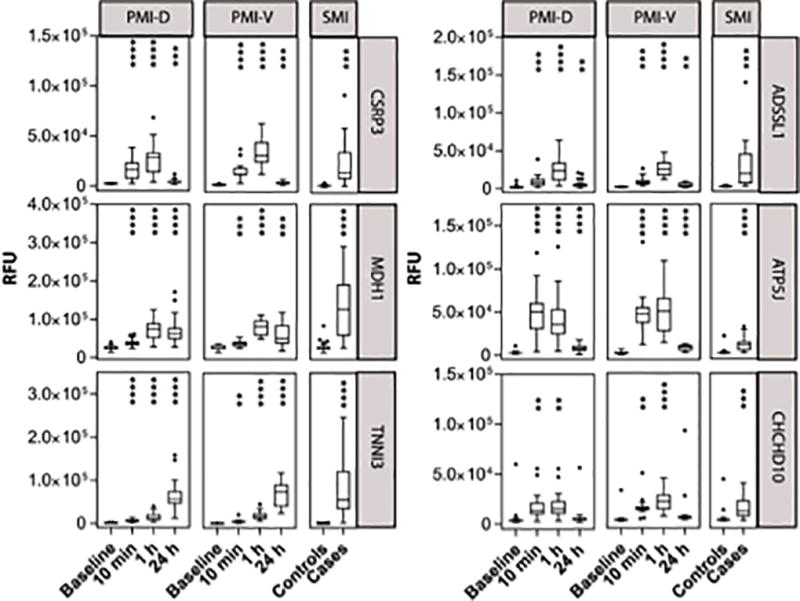
Figure 1. Protein markers that are increased early after the onset of planned myocardial injury (PMI) and in spontaneous myocardial injury (SMI).

Data presented are from PMI derivation (PMI-D) and validation (PMI-V) cohorts of selected proteins that increased in both a) derivation (n=20) and validation (n=15) cohorts (P< 1.05E-05) and b) SMI cohorts (n=63) P < 6.17–04. P values calculated by one-way repeated measures ANOVA performed on log transformed RFU values. Edges of boxes denote 25th and 75th percentiles, lines denote median, and whiskers are plotted using Tukey method. **** P < 0.0001, *** P <0.001, ** P < 0.01; where P represents significance of change from baseline.
