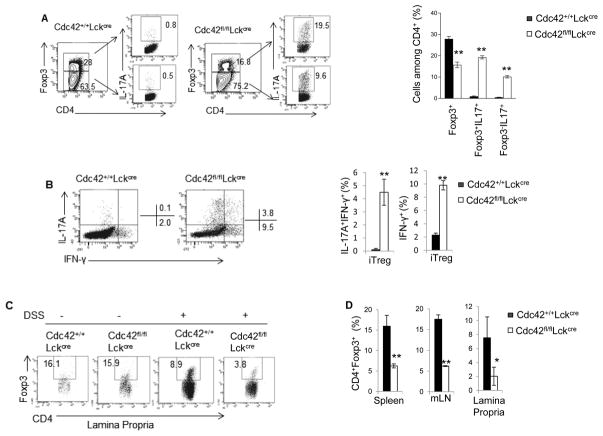
Figure 4.
Cdc42 deficiency leads to an impaired iTreg differentiation and stability in vitro and in vivo. (A) Representative flow cytogram of CD4+ T cells from Cdc42+/+LckCre and Cdc42fl/flLckCre mice cultured under iTreg polarizing condition and stained for IL-17 and Foxp3. Numbers in dot plots indicate percentages of Foxp3+, Foxp3+IL-17+ and Foxp−IL-17+ cells (left). Average percentages of Foxp3+, Foxp3+IL-17+ and Foxp−IL-17+ cells are shown in bar graph (right). (B) Representative flow cytogram of cells from (A) stained for IL-17 and IFN-γ. Numbers besides dot plots indicate percentages of IL-17+IFN-γ+ and IFN-γ+ cells in corresponding quadrant (left). Average percentages of IL-17+IFN-γ+ and IFN-γ+ cells are shown in bar graph (right). (C) Representative flow cytogram of CD4+Foxp3+ cells in the lamina propria of Cdc42+/+LckCre and Cdc42fl/flLckCre mice treated with or without DSS. Numbers indicate percentages of CD4+Foxp3+ cells. (D) Average percentages of CD4+Foxp3+ cells in the spleen, mLN and lamina propria of RAG1−/− mice transferred with naïve CD4+ T cells from Cdc42+/+LckCre or Cdc42fl/flLckCre mice. n ≥ 5. Data are representative of three independent experiments. Error bars indicate SD. *p < 0.05, **p < 0.01.

