Figure 4.


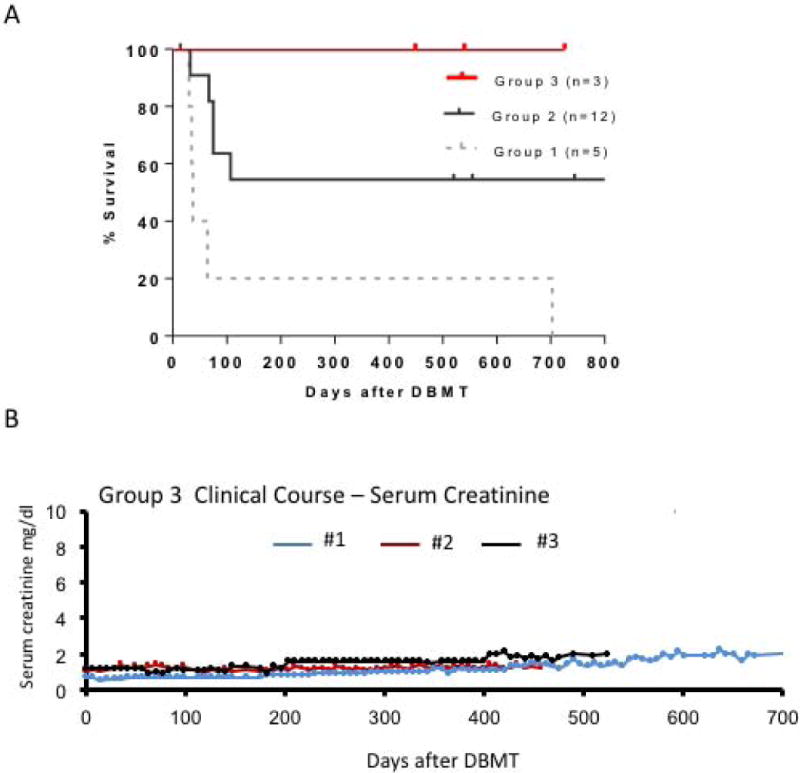
A. Renal allograft survival after DBMT
Renal allograft survival was significantly superior in recipients of the Thymo/bela regimen (red line), compared with recipients of the Atgam/aCD154 (p<0.03) regimen (dotted gray line). There was no statistically significant difference between thymo/bela and Atgam/aCD8/aCD154 (black line).
B. Serum creatinine levels after DBMT in Group 3 recipients
Serum creatinine was stable around 1.2 mg/dl during the entire observation period in Recipient #2, while Recipient #3 received his kidney from a relatively small recipient and his baseline creatinine levels were around 1.7 mg/dl. After the appearance of DSA, the baseline creatinine levels became slightly elevated (2.0 mg/dl). In Recipient #1, serum creatinine levels gradually increased from 1.0 to 2.1 mg/dl over 700 days.
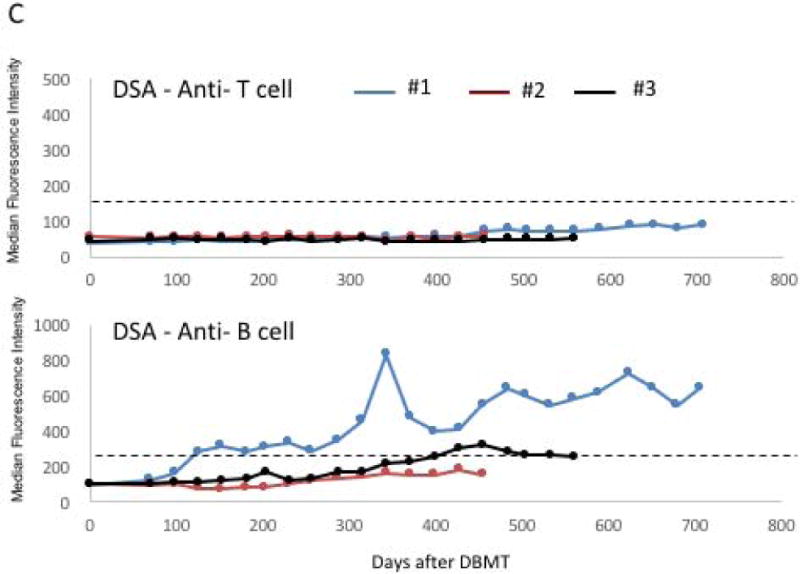
C. DSA titers after DBMT.
Anti-T cell DSA has never been detected in any of the 3 recipients. However, anti-B cell DSA, presumably against MHC-class II, became positive after day 100 post-DBMT in Recipient #1. Recipient #2 transiently developed weak DSA after day 400. The cut-off median fluorescent intensity (MFI) for positive DSA (dotted line) was defined as 3 times higher than the pretransplant DSA titer.
