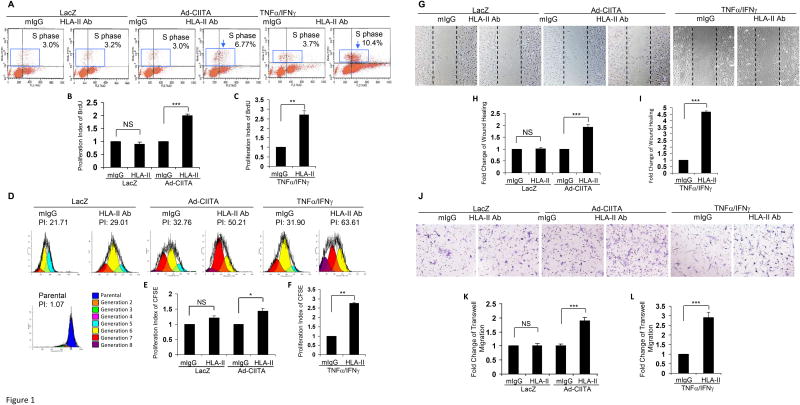
Fig. 1. HLA class II antibody stimulates EC proliferation and migration.
EC wereinfected with Ad-CIITA or pretreated with TNFα/IFNγ in 35 mm dishes coated with 0.1% gelatin for 48 h. A, EC were stimulated with 1.0 μg/ml HLA class II antibody for 48 h, incorporated with BrdU for 2 h, and harvested. EC proliferation was measured by flow cytometry. DNA synthesis S phase was gated, and proliferation index (PI) is presented as fold increase in the percent of cells positive for BrdU normalized to untreated control. D. EC were labeled with CFSE, stimulated with 1.0 μg/ml HLA class II antibody for 48 h, and harvested. EC proliferation was measured by flow cytometry and analyzed by Modfit LT software. EC proliferation was calculated using the Proliferation Wizard Model. The proliferation index is the sum of the cells in all generations divided by the computed number of original parent cells present at the start of the experiment. G. EC were pretreated with 10 μg/ml of mitomycin C for 2 h to inhibit cell proliferation before being assayed for their ability to migrate. A scratch wound was created with a sterile 200-μl pipette tip. Wounded cells were stimulated with 1.0 μg/ml of anti-HLA class II antibody for 16 h. Representative microscopy fields are shown. The cell number between two initiated front edges was counted; migration rate was analyzed by calculating the cell number between two front edges of class II-stimulated EC divided by the cell number between two front edges of control EC. J. Cell migration was measured in a transwell insert system. EC infected with Ad-CIITA or pretreated with TNFα/IFNγwere seeded to the upper chamber of insert and stimulated with 1.0 μg/ml class II antibody. After incubation for 16 h at 37°C, the cells on the upper surface of the insert membrane were removed with a cotton swab, the migrated cells on the reverse side of the insert membrane were fixed with methanol and stained with crystal violet, three middle fields per insert were photographed with 10x objective lens, and migrated cells were counted. Fluorescence 10 x microscopy images are presented. B,C, E, F. The bar graphs show the mean ± SEM fold change of proliferation index. H, I, K, L. The bar graph shows the mean ± SEM number of migrated cells. *p<0.05, **p<0.01, and ***p<0.001 were analyzed by one way ANOVA with Fisher's LSD. Data represent a minimum of three independent experiments.

