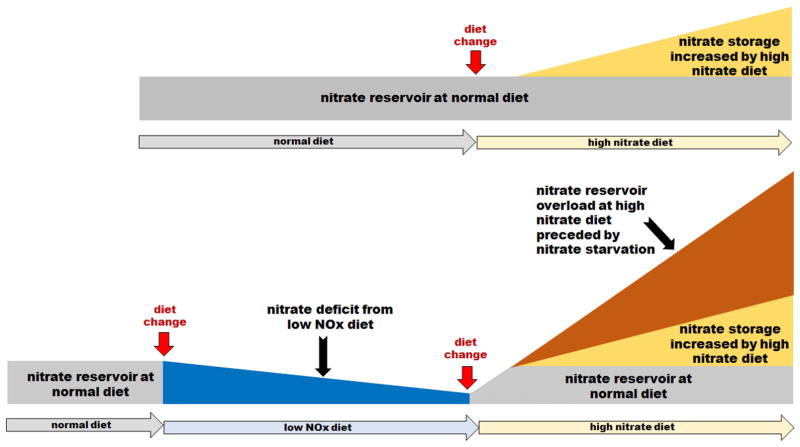
Figure 4.
Schematic representation of our experimental results on the effect of diets with different nitrate content on the nitrate levels in skeletal muscle. The upper scheme shows increase nitrate content when rats are switched from normal diet (gray area) to high nitrate diet (yellow area). The lower scheme shows nitrate depletion from skeletal muscle (blue area) after switch from normal diet to low NOx diet and then large increase of nitrate after introducing high nitrate diet. Interestingly, in this case, available nitrate in stored at levels much higher (orange area) than nitrate stored in rats on high nitrate diet without previous nitrate deprivation (yellow area).

