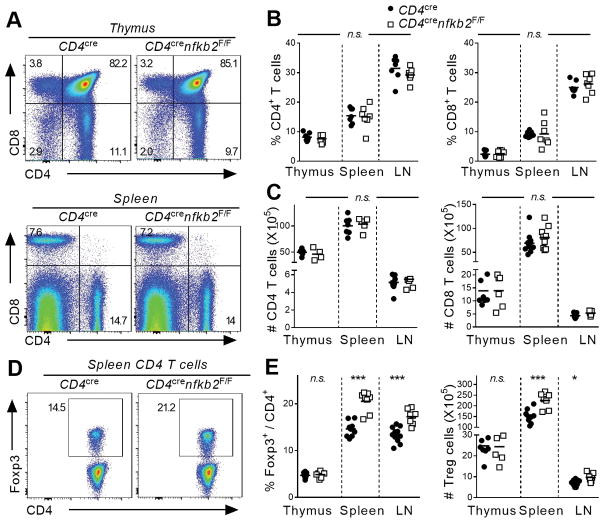
Figure 1. T-cell specific ablation of nfkb2 drives peripheral Treg cell expansion.
Thymus, spleen and peripheral lymph nodes of 6–8 weeks-old CD4cre and CD4crenfkb2F/F mice were stained for FACS. (A) Dot plot showing CD4 and CD8 expression in gated total thymus (top) and spleen (bottom) live cells. Numbers indicate the % in each quadrant. (B, C) Proportion (B) and absolute numbers (C) of live TCR-β+CD4+ and CD8+ in the indicated tissues. (D) Expression of Foxp3 in gated spleen TCR-β+CD4+ live cells. Numbers indicate the percentage in gate. (E) % in TCR-β+CD4+ and absolute numbers of Treg cells. Data is representative (A, D) or the pool (B–C, E) of 3 experiments. In B, C and D, each dot represents a mouse. *p<0.05, ***p<0.001, n.s.: non-significant.

