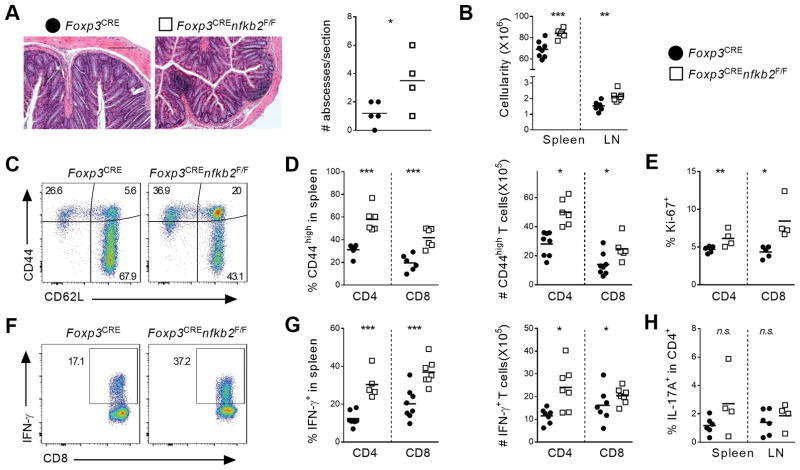
Figure 3. Uncontrolled inflammation in aged Foxp3crenfkb2F/F mice.
Tissues of 12-month-old Foxp3cre and Foxp3crenfkb2F/F mice were analyzed by histology and FACS. (A) (left) Representative section of colon stained with H/E. Bars: 200μm; original magnification 10X. (right) Quantification of abscesses (immune infiltrates) in each colon section. (B) Gross live cell count in spleen and LN. (C) CD44 and CD62L expression in gated spleen TCR-β+CD8+ cells. Numbers indicate the % in each quadrant. (D) % (in TCR-β+CD4+Foxp3− (CD4) and TCR-β+CD8+ (CD8)) and absolute numbers of CD44high T cells. (E) % of Ki67+ cells in spleen CD4 and CD8 cells. (F) Expression of IFN-γ upon PMA-ionomycin restimulation in gated spleen TCR-β+CD8+ cells. Numbers indicate the percentage in gate. (G) % (in CD4 and CD8) and absolute numbers of IFN-γ+ T cells. (H) % of IL-17A+ cells in CD4 cells. Data is representative (A, C, F) or the pool (A, B, D, E, G, H) of 3 experiments. In A, B, D, E, G, H, each dot represents a mouse. *p<0.05,** p<0.005, ***p<0.001, n.s.: non-significant.

