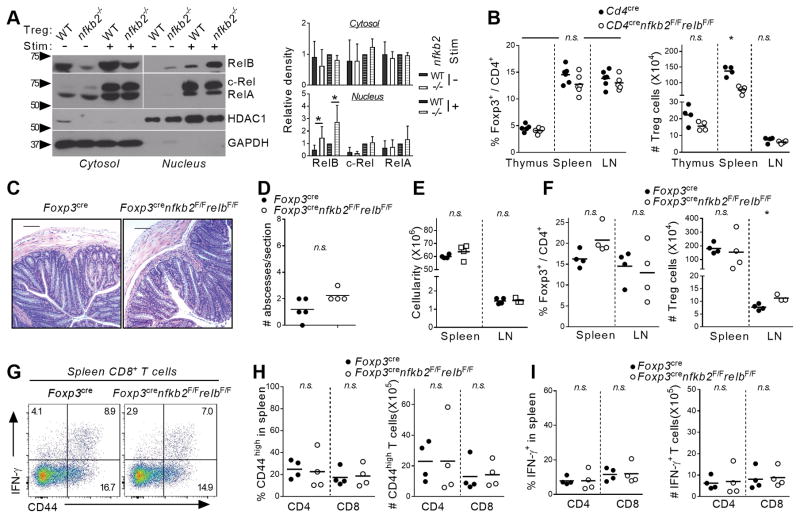
Figure 5. Overactivation of RelB in the absence of NF-κB2 drives uncontrolled Treg expansion and inflammation.
(A) Treg cells were sorted from Foxp3cre and Foxp3crenfkb2F/F spleen and LN and activated overnight with anti-CD3/CD28 Abs and IL-2. Cytosolic and nuclear lysates were separated by SDS-PAGE and membranes were blotted with the indicated Ab. (B) Thymus, spleen and peripheral lymph nodes of 6–8 weeks-old CD4cre and CD4crenfkb2F/FrelbF/F mice were stained for FACS. The % in TCR-β+CD4+ and absolute numbers of Treg cells is shown (C–G) Tissues of 12-month-old Foxp3cre and Foxp3crenfkb2F/FrelbF/F mice were analyzed by histology and FACS. (C) Representative section of colon stained with H/E. Bars: 200μm; original magnification 10X. (D) Quantification of abscesses (immune infiltrates) in each colon section. (E) Gross live cell count in spleen and LN. (F) % in TCR-β+CD4+ and absolute numbers of Treg cells. (G–I) Cells were restimulated with PMA-ionomycin prior to FACS analysis. (G) CD44 and IFN-γ expression in gated spleen TCR-β+CD8+ cells. Numbers indicate the % in each quadrant. (H, I) % (in CD4 and CD8 cells) and absolute numbers of CD44high and IFN-γ+ T cells, respectively. Each dot represents a mouse. Data is representative (A, C, G) or pooled (B, D–G, H–I) from 2 to 4 experiments. *p<0.05, n.s.: non-significant.

