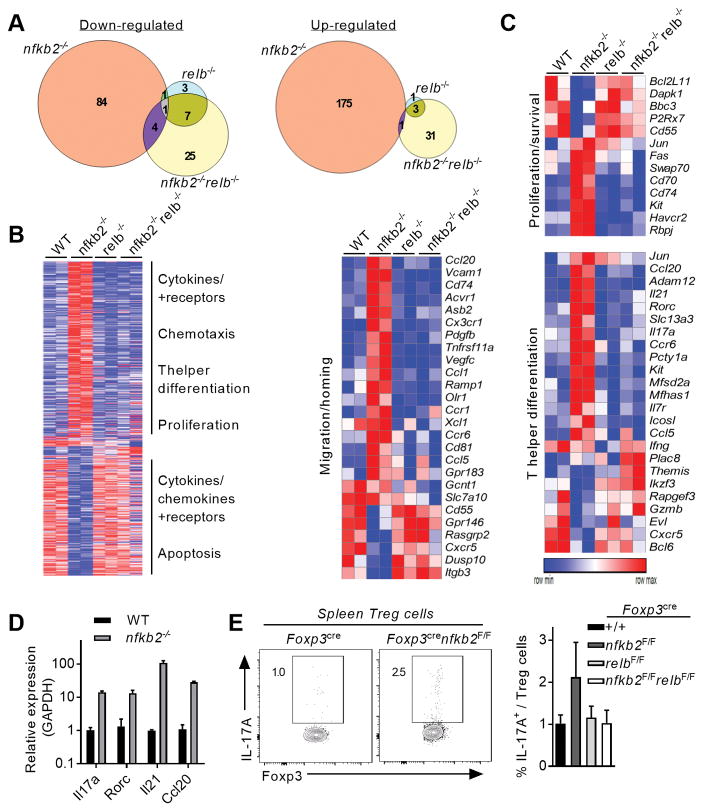
Figure 6. NF-κB2 represses aberrant expression of inflammatory and homing genes in Treg cells.
Treg cells were sorted from Foxp3cre, Foxp3crenfkb2F/F, Foxp3crerelbF/F mice and Foxp3crenfkb2F/FrelbF/F mice (3 mice/genotype), activated overnight and processed for RNA-seq. (A) Venn diagrams showing genes with a fold-change <0.6 and >1.5 and a p-value< 0.05 compared to WT Treg cells. (B) Unsupervised hierarchical row clustering. Only genes with changed expression in at least 1 genotype is shown. The biological functions indicate selected enriched pathways upon GSEA and Metacore analysis. (C) Heatmaps showing the relative expression of selected genes enriched in different biological processes. (D) qRT-PCR quantification of selected genes. Mean +/− SEM of expression relative to GAPDH is shown. (E) Spleens of 12-month-old mice were analyzed by FACS. (left) relative expression of IL-17A in gated Treg cells; numbers indicate the % in the gate. (right) Mean +/− SEM of IL-17A expression in spleen Treg cells. Data is from two (A–C) or 3 (D–E) experiments.

