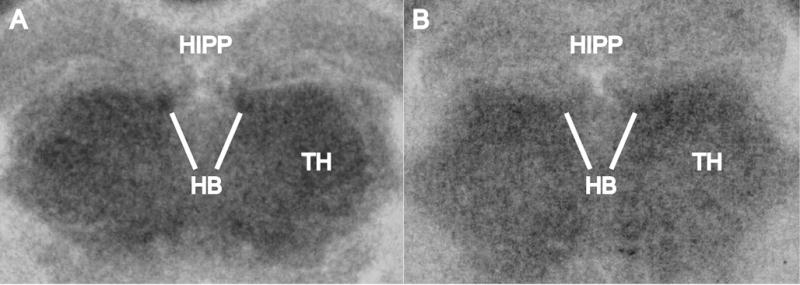
Fig. 2.

Representative FDG autoradiographs showing the habenula (HB), thalamus (TH), and hippocampus (HIPP) in images developed from coronal sections of the mouse brain at the level of HB. The white lines point to HB to illustrate the increase in FDG uptake in A as compared to B. However, the results reported in the paper are not based on visual inspection of autoradiographs; rather, they are based on quantitative densitometric analysis and group statistics that showed that HB had a statistically significant FDG increase in the acquisition group as compared to the extinction group.
